Bitcoin Price Intermediate Advance without Bitstamp
Bitcoin Price continues making higher highs in cautious trade above rising support. Confirmation of a larger degree uptrend is not yet in evidence, but we do have sufficient signals for an intermediate price advance. The Bitcoin Price has been surprisingly active given the service hiatus of one of the largest Bitcoin exchanges. Said Bitcoin exchange, Bitstamp, has also suffered a confirmed loss of ~$5 million USD worth of bitcoin. Update. Time of update: 11h30 UTC. Divergence has forced price down and it is correcting before moving toward the target discussed in the trade setup in the....
Related News

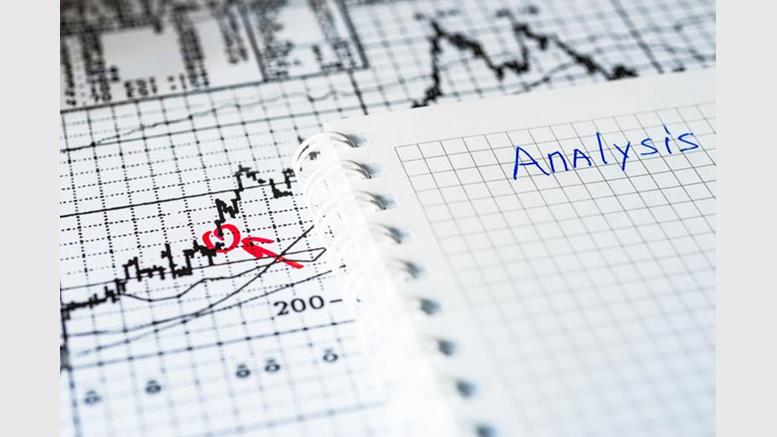
Bitcoin price is drawing close to its 4hr candle chart 200-period moving average (200MA). Crossing above it will signal an intermediate period of advance. Consolidation is drawing to an inevitable close as the 4hr 200MA descends into the area of price action. To the upside we have Fib extension targets all the way up to long-term resistance at $680. Likely pitstops for reaction wait at $600, $610 and $630 (Bitstamp). For the advancing scenario to open we need to see price advance above the 4hr 200MA (red). The 200MA is critical at every timeframe, and intermediate trend is signaled by....

Bitcoin price achieved $450 (Bitstamp) and 2900 CNY (BTCC) overnight. Since then price has entered a pullback that appears incomplete at the time of writing. A strange advance that is not yet surging above the long-term resistance it has just broken (grey trendline). The expectation was that the slow push higher would turn parabolic on the successful push through resistance at $430 (Bitstamp). In the 4-hour timeframe, RSI is reverse diverging to the December high and the advance must now push through a supply level that has been in effect since November of last year. Although the slow....

The bitcoin price chart bubbles along just below $700 (Bitstamp) and mood in Bitcoin Land is positive. At the time of writing price is retesting the $680 (Bitstamp) level. The bitcoin price chart is receiving calls for a top at $700 and price is currently testing the critical $680 support and resistance level. As pointed out in yesterday’s longer-term analysis, the $680 level represents the high range of an area of contention (during late 2013 and the first half of 2014) that reaches all the way back down to $600 and 4000CNY. If price penetrates this level then a free-fall zone all the way....

Bitcoin price has halted decline and may have found support at the $555 (Bitstamp) level. The 4-hour candle chart shows that advance is possible, but that a critical watershed for decline remains close-by. Price action has stopped making lower lows – for now – and we’re yet to see a series of higher highs. It’s too early to discard the notion of additional decline since the past day’s upside pattern may only be an upward correction. While we wait for the chart to develop further, let’s consider intermediate trend in the 4hr hour chart. I had mentioned, prior to the drop from $650, that a....

Bitcoin price has corrected the past week's spectacular advance in five waves to the downside. The decline may be over or it may still reach lower in the days ahead. Let's see what clues there are in the chart. This analysis is provided by xbt.social with a 3 hour delay. Read the full analysis here. Not a member? Join now and receive a $29 discount using the code CCN29. Bitcoin Price Analysis. Time of analysis: 14h45 UTC. Bitstamp 15-Minute Chart. From the analysis pages of xbt.social, earlier today: The 15-minute chart, above, shows a close up of price action during the past five days,....