
Litecoin Price Weekly Technical Analysis (26th Jan - 1st Feb)
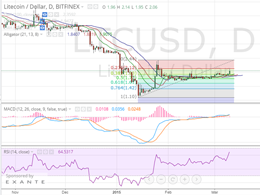
Litecoin price started last week by dropping from around $2.2 to $1.66, yet the momentum of the market changed as it started rising up again on the 1st of February. It's quite obvious how litecoin has been exhibiting a rather long bearish wave since it reached $48, its all-time high recorded back in 2013. To identify current resistance and support levels, we will draw a trend line between the high reached on the 13th of November, 2014 ($4.36) and the low reached on the 14th of January, 2015 ($1.13) and then plot the Fibonacci retracement accordingly on the 1 day Bitfinex (LTC/USD) charts....
Related News

If there was a competition right now between our beloved hero Superman and the cryptocurrency Litecoin, I think even our iconic hero would say for once “Okay, let's catch a break!” Litecoin is breaking all the fathomable boundaries, having jumped from $2 to more than $8 in just the past 4 weeks. And with momentum and trend remaining overtly bullish, there is no saying what valuations we will see going ahead. Litecoin has jumped a massive, a phenomenal 31% in the past 24 hours to leapfrog to $8.100. In today's analysis, we are taking a departure from the normal routine in a way that a....

Litecoin has dropped 6.47 percent to trade at $2.733 as the underlying negativity comes to the fore. We discussed in the previous Litecoin price technical analysis The Pressure is Evident that there is a very low probability of the price trending higher and that bears may make an early comeback. This decline has also brought the price closer to its very important technical support of the 200-day simple moving average (SMA). The question that the trading community is now asking is: will this level cushion Litecoin once again? I continue to remain bearish on Bitcoin as well, which I believe....

In the previous Litecoin price technical analysis Flat Action, we discussed that if Litecoin fails to cross the resistance posed by the level of $3.160, it runs the risk of entering into a range. As can be seen, Litecoin has plummeted 4.44 percent to $2.907 as traders resorted to profit taking near the resistance. Another factor weighing on Litecoin is the weakness in the Bitcoin market. However, the good news is that Bitcoin is now close to its support level of $235. Values from the technical indicators overlaid on the daily LTC-USD price chart also suggest that there is an increased....
Litecoin price continued rallying today to print a high of around $2.14 a couple of hours before writing this analysis. Although the price rose to test the 23.5% Fibonacci retracement level at $2.12 today, the following hours will decide whether or not litecoin price will manage to break through this essential resistance level. By studying the 4 hour Bitfinex (LTC/USD) chart from tradingview.com, plotting the William's Alligator indicator and drawing Fibonacci retracement levels along a trend line that extends between the low reached on the 14th of January at around $1.10 and the high....

Litecoin falls 1.47 percent to $3.075 after kissing the resistance at $3.130. In the previous Litecoin price technical analysis, we said that Litecoin could leapfrog to higher levels on consistent support from the buyers, but what we have got instead is a bout of profit booking which once pulled down the price to an intraday low of $3.050. But can this decline prove fatal to Litecoin? Will the crucial support of $3.000 be breached? Let us try to find that out by conducting a technical analysis on the daily LTC-USD price chart. Litecoin Chart Structure - As can be seen, the higher top,....