
Logarithmic Scale - An Optimist's Take on the Price of Bitcoin
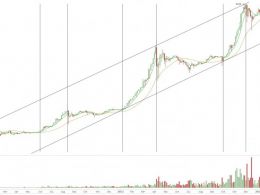
By now we are all familiar with the price chart bitcoin pessimists throw at us when discussing the imminent "death" of bitcoin and the digital currency space as a whole. The classic bubble spike to above $1000 and the collapse to where we now sit just ahead of $200 does, indeed, lend credence to the suggestion that bitcoin has yet further to fall in value. However, there is a much more logical way to chart changing values over time when looking at something like digital currency - a logarithmic chart. From a logarithmic chart, somebody looking at bitcoin price versus the US dollar can gain....
Related News

In this episode of NewsBTC’s daily technical analysis videos, we examine a possible breakout of Bitcoin price on linear scale. We also compare the breakout on logarithmic scale to determine if the signal might be a reliable sign the bottom could be in. Take a look at the video below: VIDEO: Bitcoin Price Analysis (BTCUSD): October 6, 2022 Related Reading: Bitcoin Bulls Snap Back With The Bollinger Bands | BTCUSD Analysis October 5, 2022 Is This The Bitcoin Breakout We’ve Been Waiting For? Bitcoin price has broken out of an important downtrend line on linear scale. The....
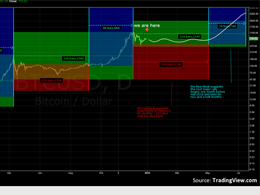
The purpose of this article is to advise that, on a time frame cyclic basis, we are at the normal time that a low is formed in the Bitcoin market. This means that if the market performs as it has in the past, which is certainly no guarantee, we may be near the low point between periods of price advances. Typically, Bitcoin follows phases similar to those described in 'Dow Theory'. Spotting the low in these phases is crucial to good investment timing. Normally the best time to buy follows the end of a 'bear' market. At this time, pessimism is at a maximum and prices have already fallen....

As Bitcoin price rises to new heights, top traders say the monthly and logarithmic chart signal that BTC is entering a new bull trend. Peter Brandt, a well-regarded veteran trader, recently emphasized the high demand from institutions as a key catalyst for Bitcoin's strong performance. BTC/USD 1-month chart. Source: TradingViewThe strong high time frame technical structure of BTC, especially the weekly chart, and the strengthening fundamentals are buoying the market sentiment. In a tweet, Brandt posted the above chart and said:“Bitcoin—IF the current gains hold through end of Oct—is poised....
Mystery Chart showing Bitcoin price in USD on Gox (in logarithmic scale) plus Mystery Indicators. On August the 23rd of 2013, the so-called "Mystery Chart" thread was opened on BitcoinTalk. It shows a log scale of the Bitcoin price in USD on Gox, plus an unusual indicator. This indicator seems to plot a shallow sine wave, a moving average, an oscillator and... some frequencies? I really have no idea what that thing is, perhaps a Hilbert Sine Wave indicator with some mods, but it's certainly interesting... Especially as it did a great job of calling the recent double top! The thread title....
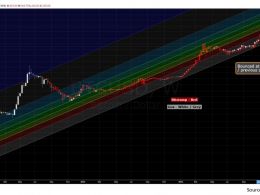
The Channel Low. In my previousCryptoCoaster video, I forecast that an extreme negative case would see Bitcoin price reach the long-term channel low. The following weekly logarithmic chart shows that this scenario has played out with some precision, the channel low and previous double bottom were a likely point for reversal: Weekly logarithmic chart showing Fibonacci channel and support. The Gox Bitcoin price is now history. While I considered such a move unlikely, this was before the fatal nature of Mt. Gox's situation came to light. I'd long considered Gox to be sketchy and tried to....