
Bitcoin Price Technical Analysis for 18/2/2015 - Bullish Requiem
Bitcoin price continued to rise yesterday scoring a high of $244. The pattern of the new bullish wave has been established as we explained during our yesterday's "intraday tips" article. By analyzing the 1 day Bitfinex (BTC/USD) charts and plotting the RSI and the 20 day EMA accordingly (look at the below chart), we can conclude the following: The current bullish trend can be viewed as a continuation of the bullish wave that started on the 15th of January, if we consider that the first bullish rally had been halted by a price correction wave that triggered sideways movements for a few....
Related News
Bitcoin price increased today, just as our analysis from yesterday predicted, reaching a high of $242.54; so, we are expecting a continuation of this bullish wave to take the price up to $300 during the next few days. By looking at the 1 day Bitfinex (BTC/USD) charts from tradingview.com and drawing a trend line between the high reached on the 13th of November, 2014 ($472.49) and the low reached on the 14th of January, 2015 ($167.05) and plotting the Fibonacci retracement fan accordingly, we can notice how today's trading pulled the price up to $242.54. The new bullish wave will likely....

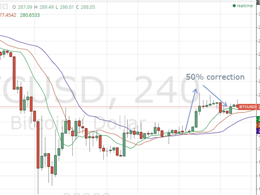
Bitcoin price dropped yesterday from a high of $284 to a low of around $267. Since the start of the new bullish wave on the 1st of March, bitcoin price failed for the first time yesterday to continue printing higher highs. Technical analysis shall give us clues of whether or not the bullish wave will continue on today to push the price to higher levels after yesterday's downtrend. By studying the 4 hour Bitfinex (BTC/USD) chart from tradingview.com, plotting the William's Alligator indicator and drawing a Fibonacci retracement fan across a trend line that extends between the high reached....

Bitcoin briefly topped $250 for the first time since August 19, 2015, hitting a fresh monthly high of $250.09. We concluded the previous Bitcoin price technical analysis Retreats From Monthly Highs on a positive note saying that market participants should not be concerned about the drop and instead go long in Bitcoin near $242 for a target of $250. As can be seen, Bitcoin hit an intraday low of $242.82 before meeting the said target. Bitcoin is currently trading at $248.81, up 1.92 percent. And yes, we stand by our long call! bitcoin price chart. Below are the latest technical....
Bitcoin price is continuing to make higher highs which confirm the bullish momentum of the market throughout the past few days. We have been adding up the bullish signals via our daily analysis articles this week. Bitcoin Price Technical Analysis. By observing the 1 day Bitfinex BTC/USD charts from tradingview.com (look at the below chart), we can see that bitcoin price closed at increasing highs on 2 successive days. At the time of the writing of this article, the price exceeded $233 and is expected to increase even more to surpass yesterday's closing price. By plotting the MACD on the....

Bullish bias is still evident in Litecoin even as the cryptocurrency fell sharply from 2.14 to 1.98. As discussed in yesterday's analysis, the recent correction in Litecoin presents to us an incredible opportunity to buy as the price structure strongly favors the bulls. Each Litecoin is currently trading at $2.05. A precise technical analysis on the 240-minute LTC/USD price chart indicates that the digital currency may have bottomed out and head higher to take out the 2015-peak eventually. Technically, Litecoin seems to be enjoying a positive undertone. Price chart and technical indicators....