Bitcoin Price Technical Analysis for 22/2/2015 - Slowing Down
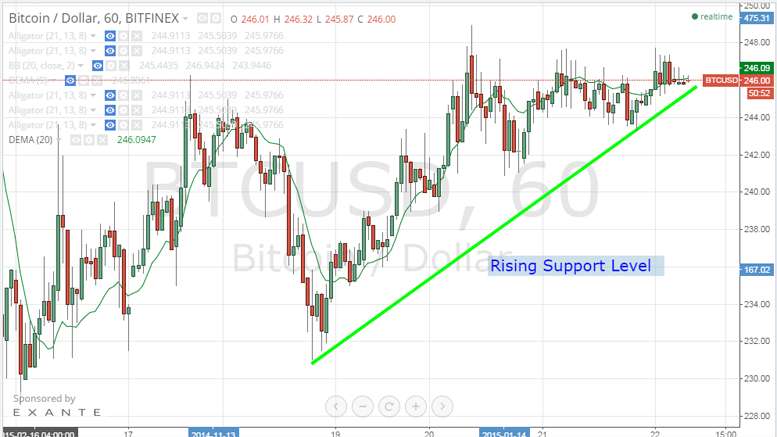
Bitcoin price continued to approach the $256 resistance level territory yesterday, recording a high of around $248 and a low of around $243. The low trading volume of yesterday's market is the main reason why the price didn't rise up to higher levels. By studying the 1 hour Bitfinex (BTC/USD) charts from tradingview.com and plotting the 20 hour EMA (look at the below chart), we can notice the following: Bitcoin price has been trading yesterday outside the trend lines we plotted on our analysis on the 20th of January; however, the price remained to exhibit rising support levels as shown by....
Related News

The highly volatile digital currency seems to have gone into a hibernation mode, barely moving in the past one week. As mentioned inyesterday's analysis, the bulls are finding it tough to pose serious threats to the shorts as Bitcoin still lingers around $290. Technical analysis on the 240-minute BTC/USD price chart reveals that the consolidation period may extend for a while. Moving Average Convergence Divergence - The Signal Line is slowing catching up with the MACD and as a result, the Histogram value is retracting to 0. A declining Histogram value indicates that the bulls are losing....

The Christmas isn’t turning out to be merry for Bitcoin. The cryptocurrency is struggling near the overhead resistance of $465. It is now trading 1.28% lower at $450.89, raising concerns that the market participants might pull out their funds in the holiday season. As a result, several technical indicators are also showing declines. We advised in the previous Bitcoin price technical analysis Target Achieved that traders should book at least partial profits in their long positions. And for today’s analysis, we will again be using the 4-h BTC-USD price chart from BITSTAMP.

Bitcoin rises more than 2 percent to $430.21, nearing our year-end target of $440. In the previous price technical analysis A No Trade Market, we mentioned that an increasing MFI often causes price appreciation, and we are witnessing just that. The question now is: Would bitcoin be able to extend the gains or will it retrace its steps? Let us try to predict this with the help of technical analysis conducted on the 240-minute BTC-USD price chart. Bitcoin is well poised to increase its duration inside the $400-440 range, at least for the next couple of sessions. There is a high probability....

In the previous Bitcoin price technical analysis Rebounds, we discussed how the cryptocurrency was erasing the losses for the past week. But, the entire positivity was put to rest over the weekend as bears made a comeback and long positions were fast liquidated at the slightest hint of a pullback. Bitcoin, which is now trading at $227.93, has once again come closer to its important buying interest zone of $220-225. As the price decline has pushed the price closer to its crucial support, market participants may also be factoring in a breach of support this time, but I would recommend....

Bitcoin briefly topped $250 for the first time since August 19, 2015, hitting a fresh monthly high of $250.09. We concluded the previous Bitcoin price technical analysis Retreats From Monthly Highs on a positive note saying that market participants should not be concerned about the drop and instead go long in Bitcoin near $242 for a target of $250. As can be seen, Bitcoin hit an intraday low of $242.82 before meeting the said target. Bitcoin is currently trading at $248.81, up 1.92 percent. And yes, we stand by our long call! bitcoin price chart. Below are the latest technical....