Bitcoin Price Technical Analysis for 23/4/2015 - Pullback Watch
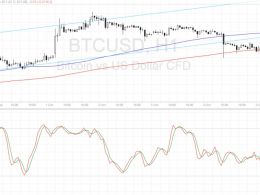
During the April 22nd session, bitcoin uncoiled upwards. The 1H chart shows not only a breakout from volatility, but also above consolidation resistance near 230. As the session wound down, the rally stalled around 239 at which point price stalled and formed a bearish divergence with the RSI. (When price makes a higher high and the RSI a lower high). Bitcoin (BTCUSD) 1H Chart April 23. After finding resistance at 239 along with the bearish divergence, price retreated as the April 23rd global session began. The pullback has been weak so far, holding around 233. The technical conditions in....
Related News

In the previous Bitcoin price technical analysis Rebounds, we discussed how the cryptocurrency was erasing the losses for the past week. But, the entire positivity was put to rest over the weekend as bears made a comeback and long positions were fast liquidated at the slightest hint of a pullback. Bitcoin, which is now trading at $227.93, has once again come closer to its important buying interest zone of $220-225. As the price decline has pushed the price closer to its crucial support, market participants may also be factoring in a breach of support this time, but I would recommend....

Rubycoin Price Technical Analysis. Rubycoin price is in the middle of a correction but it looks like the pullback is already over, as the 50% Fibonacci retracement level is holding as strong resistance. This retracement level lines up with a former support level, making it an area of interest and likely resistance. Rubycoin price has made a sharp selloff recently and might be done with its retracement from the move, allowing sellers to regain control. Spinning top at resistance? A spinning top reversal candlestick has formed on the latest pullback, hinting that price could turn a corner. A....
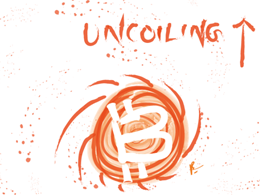
Since making a low on the month just above 216 bitcoin rebounded to 230 and start coiling as we can see in the 1H chart. Towards the end of April 21st session, btcusd started to uncoil upwards. Let's take a look at the charts: Bitcoin (BTCUSD) 1H Chart April 22. As we can see in the 1H chart, bitcoin not only broke above a triangle, it also charged above the 230 resistance. There was strong volume, and the 1H RSI popped up above 80. The price action suggests that the bullish breakout is very likely to extend. In the very near-term however, the RSI is overbought, so we can expect some....

Bitcoin is seeing a tepid start to this week as neither the bulls nor the bears exert any pressure on the other. The cryptocurrency looks relatively calm in the low-volume season, as do the technical indicators. Market participants should refrain from excessive trading in such conditions. Bitcoin is currently trading at $421.53. The technical indicators overlaid on the 4-h BTC-USD price chart from BITSTAMP are giving mixed signals. This, coupled with the lackluster price action, is compelling me to advise that this is a no-trade market, and one should wait for better opportunities to....
Bitcoin price could be ready to resume its dive after this quick correction, but the consolidation does look like a continuation signal. Bitcoin Price Key Highlights. Bitcoin price recently broke below its ascending channel support visible on the 1-hour and 4-hour charts. This signals that the uptrend may be over and that a reversal is in the works. Price found support at the 200 SMA and made a pullback to the broken channel floor, which might now hold as resistance. Technical Indicators Signals. The 100 SMA is above the longer-term 200 SMA still, which means that the path of least....