
Bitcoin Price Technical Analysis - Bulls Still Charging!
Bitcoin Price Key Highlights. Bitcoin price has been in good spirits these days, as it has taken out one resistance level after another. Price made a quick short-term retracement before revving up for another ride north, setting its sights on the rising channel resistance. Increased bullish momentum could keep bitcoin price climbing, possibly until the top of the rising channel on the daily time frame. Aiming for $350? Now that price has broken past the significant $300 barrier, bitcoin could head all the way up to the next resistance at the $350 level, which is right in line with the....
Related News

Ethereum price seems to have its sights set higher after breaking out of a descending triangle on its 4-hour chart. Technical indicators are also supporting further gains. Ethereum price had previously consolidated inside a descending triangle pattern, forming lower highs and finding support at 0.00250. At the moment, ethereum price is testing the near-term resistance at the 0.00300 level, waiting for more bulls for another leg higher. An upside break past this level could take it up to the next area of interest at 0.00330-0.00350 then onwards to the larger triangle highs at 0.00400.
Bitcoin price seems ready for a reversal since bulls were able to push past the long-term descending trend line and technical indicators are turning. Bitcoin Price Key Highlights. Bitcoin price was previously trending lower on its longer-term charts, moving below a descending trend line on its 4-hour time frame. Price just broke past the neckline after the U.S. printed a weaker than expected jobs report for August, triggering dollar weakness. This signals that the downtrend might be over and that bitcoin could be in for a strong uptrend. Technical Indicators Signals. The 100 SMA is....

Bitcoin Price Key Highlights. After consolidating inside a descending triangle pattern for quite some time, bitcoin price finally picked a direction and broke to the upside. As predicted in the previous article, a breakout had been looming this week since price has been moving closer to the peak of the triangle. Bitcoin price could be in more gains from here, with technical indicators hinting that the upside breakout could be sustained. How High Can It Go? Bitcoin has just moved past the moving averages, which seemed to be the line in the sand for any gains. This suggests that price is....

Don’t be alarmed by the current slump in the bitcoin price. In fact, there is still cause for optimism. The market is going through a reversal pattern to the $700 level, where a congestion area should reinforce quotes for another climb to $820, keeping us right on track to hit the projections advanced last week. Bitcoin Price Analysis: Bulls Still in Control. Long-Term Analysis. After testing the lowest support at the $580-$600 level, prices should enter an upward reversal pattern soon, which will allow an initial pull back to $700, extended to Fibonacci´s technical objective at $820. The....

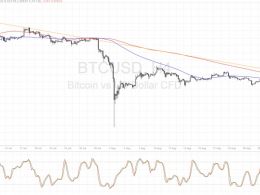
All hell has broken loose in the Bitcoin market! The price of Bitcoin crashed more than 13 percent intraday after bears crushed the bulls following the Bitcoin XT controversy. As of now, short covering has helped lift the price up to $235.66, still off more than 7 percent. With this, all the hard work done by the bulls since June has been undone. In the previous Bitcoin price technical analysis, The Pressure is Simply Too Much, I had clearly stated that if the selling pressure were to increase even slightly, it would lead to a breakdown kind of situation in the cryptocurrency. My short....