Dogecoin Price Weekly Analysis - Signs of Important Reversal
Key Highlights. The Dogecoin price started a correction phase and currently forming a major triangle pattern on the hourly chart. Buyers need to step in and take the price above the highlighted triangle for a rally towards 45.0. Looking at the feed from CEXIO, there is already a break in favor of buyers above a bearish trend line. Dogecoin price is showing important signs of reversal and eyes a break above the 100 hourly MA for more gains. Importance of 100 MA. We were anticipating a corrective rally in the Dogecoin price, and it broke the shackles around 30.0 Satoshis. The corrective....
Related News
Dogecoin Price Key Highlights. We highlighted this past week a contracting triangle pattern on the hourly chart, which acted as a pivot and caused a break. There was a downside break as anticipated which took the price towards another important support area of 56.5 Satoshis. The price is below the 100 hourly simple moving average (SMA), which is a worrying sign for buyers. Dogecoin price breached an important breakout pattern this past week, and showing more bearish signs on the hourly chart. Triangle Break. In one of the recent analysis, we highlighted a contracting triangle pattern on....
Dogecoin Price Key Highlights. Dogecoin price moved lower and broken an important support area around 42.0 Satoshis. A bullish trend line and support area was breached to open the doors for more losses. 0 Satoshis might now act as a resistance, as the 100 hourly simple moving average is also positioned around the stated level. Dogecoin price is under the bearish pressure as sellers managed to take the price below a critical support area. Importance of 100 MA. As highlighted in the weekly analysis there were some signs of relief for the Dogecoin price, but that did not last forever. There....
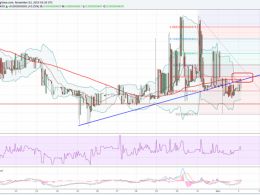
Dogecoin price has been consolidating tightly on its short-term time frames but zooming out to the longer-term charts shows a potential reversal. In fact, a doji candlestick has formed on the weekly time frame, awaiting confirmation for a possible rally. The next weekly candle has to close above the previous doji's high before confirming the bounce off the current support levels. A long-term climb could last until the next resistance at 60 satoshis. Stochastic on the daily time frame of dogecoin price on Hitbtc is moving between 20 and 40 on its way up, indicating a possible pickup in....

The price of Dogecoin (DOGE) has continued to remain strong against Tether (USDT) despite growing bearish market sentiment as other crypto assets continue to decline in price. Bitcoin has shown bearish signs after being rejected from $25,200, but the price of DOGE has continued to trend higher with eyes set on the $0.1 mark. Related Reading: Bitcoin And Ethereum Retrace Before Crypto Sentiment Could Reach “Greed” Dogecoin (DOGE) Price Analysis On The Weekly Chart From the chart, the price of DOGE saw a weekly low of $0.052, which bounced from that area and rallied to a price of $0.088....
Key Highlights. Dogecoin continued to move lower as can be seen clearly on the daily chart. 5 satoshis is a major hurdle for Dogecoin where buyers might continue to struggle in the near term. The Daily Dogecoin/Bitcoin price chart suggests that sellers are in control, as Dogecoin moved lower to test 30 satoshis. It managed to find support and traded back higher, but found resistance around an important bearish trend line. There is a major cluster of hurdles formed at 39.5-40.8 satoshis, which is coinciding with the highlighted trend line. The Dogecoin price is also below the middle band of....