
Ethereum Price Technical Analysis for 23/11/2015 - Bounce, Bounce, Bounce
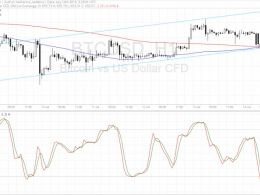
Ethereum Price Key Highlights. Ethereum price appears to be creating a range on its 1-hour time frame, unable to sustain its momentum after an earlier breakout. Price found resistance at 0.00300 and support at the 0.00285 area. Ethereum price just bounced off the top of its range and may be ready to test the bottom once more. Ethereum price could continue with its sideways movement, as technical indicators aren't offering any signals for directional plays. Short-Term Profit Opportunities. With that, ethereum traders might simply go for short-term gains, buying off support and selling at....
Related News

Ethereum has undergone a strong bounce since the lows seen in September. As of this article’s writing, the coin trades for $372, around 20% above those lows. The cryptocurrency is about the set a weekly close above the $365-370 resistance. Despite this strong bounce in the price of Ethereum, on-chain metrics show that the blockchain is currently weakening. Fortunately, the leading cryptocurrency has positive fundamental and technical trends that may result in growth in the […]

Neucoin Price Key Highlights. Neucoin price has been sliding lower, mostly driven by bitcoin price strength in the past few days. This has taken price all the way down to its lows for the month at 0.000021, at which profit-taking might take place and pave the way for a quick bounce. Neucoin price could see a bit more upside from here, especially if traders book profits off their positions by the end of this month. Technicals Support a Bounce. Technical indicators are also suggesting that a bounce might be in order, as the selloff is overdone. Stochastic is in the oversold region, which....
Bitcoin price could be due for a bounce off this support zone and technical indicators appear to be in agreement. Bitcoin Price Key Highlights. Bitcoin price underwent additional volatility and sold off yesterday but it appears to be testing another support area. Price is forming an ascending channel pattern on its 1-hour time frame and might be due for a bounce towards the resistance. Technical indicators are also suggesting that buyers could regain control. Technical Indicators Signals. The 100 SMA is crossing above the longer-term 200 SMA to confirm that the uptrend could carry on. In....
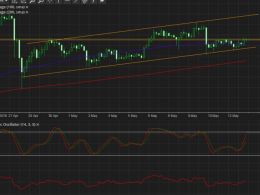
Bitcoin price has been consolidating at the bottom of the ascending channel, with buyers still trying to push for a bounce. Bitcoin Price Key Highlights. Bitcoin price has been trending higher and moving inside an ascending channel on its 4-hour and 1-hour time frames. Price is still hovering around the channel support and a bounce might be in order. If so, bitcoin price could make another test of the resistance around $465. Technical Indicators Settings. The 100 SMA is above the longer-term 200 SMA, confirming that the path of least resistance is to the upside and that the uptrend could....
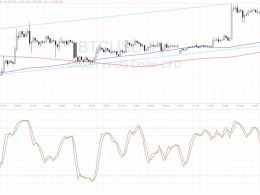
Bitcoin price could be due for a test of the channel support once more, with technical indicators confirming a potential bounce. Bitcoin Price Key Highlights. Bitcoin price is still inside its ascending channel pattern after getting rejected on its attempt to break past the resistance. Price could be headed for the channel support for another bounce higher. Technical indicators suggest that the uptrend could carry on. Technical Indicators Signals. The 100 SMA lines up with the channel support around $665, adding to its strength as a potential floor. In addition, the 100 SMA is safely above....