
Ethereum Price Technical Analysis for 08/01/2016 - Watch out for this Pullback!
Ethereum price might be ready to resume its drop to its previous lows or much lower after correcting to an area of interest. Ethereum price had been moving inside a range between resistance near 0.00230 and support at 0.00215 before breaking to the downside. Price dipped to a low of 0.00205 before showing signs of a pullback. Using the Fibonacci retracement tool on the latest swing high and low shows that the 50% level lines up with the broken support, which might now hold as resistance. Ethereum price might be ready to resume its drop to its previous lows or much lower after correcting to....
Related News

Ethereum Price Key Highlights. After forming a head and shoulders pattern indicated in yesterday's technical analysis article, ethereum price broke below the neckline and confirmed the potential selloff. Price also broke below the rising trend line support, adding to the downtrend signals on the 1-hour time frame. Ethereum price could have its sights set on the next visible floor around 0.0200, although a pullback to the broken neckline and trend line support might be seen. Resistance at 61.8% Fib? The 61.8% Fibonacci retracement level is closest to the broken rising trend line and is also....

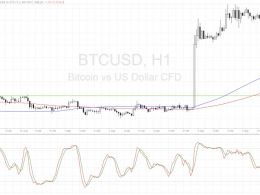
During the April 22nd session, bitcoin uncoiled upwards. The 1H chart shows not only a breakout from volatility, but also above consolidation resistance near 230. As the session wound down, the rally stalled around 239 at which point price stalled and formed a bearish divergence with the RSI. (When price makes a higher high and the RSI a lower high). Bitcoin (BTCUSD) 1H Chart April 23. After finding resistance at 239 along with the bearish divergence, price retreated as the April 23rd global session began. The pullback has been weak so far, holding around 233. The technical conditions in....
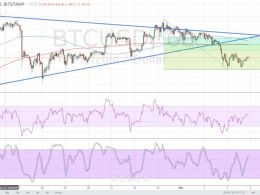
Bitcoin price might be in for a quick pullback to the broken triangle support before carrying on with its drop. Bitcoin price has formed a small double bottom pattern, indicating that a quick rally could take place. This could stall around the broken triangle support near the $430 level and the 61.8% Fibonacci retracement level. A shallow pullback could last until the 50% level or the $428 mark, which is also near the dynamic resistance at the moving averages. For now, the 100 SMA is above the 200 SMA but a downward crossover could confirm that the selloff is about to resume. An even....
Bitcoin price could be due for more declines after making a downside break of consolidation and forming a reversal pattern. Technical indicators are suggesting a potential bounce for now, with the 100 SMA above the 200 SMA and oscillators moving out of the oversold levels. Both RSI and stochastic are also showing slight bullish divergences, hinting that buyers could come back in the game and trigger a pullback or rally for bitcoin price. A pullback could lead to a test of the broken triangle support near $430 and the moving averages, which might hold as dynamic inflection points. A larger....
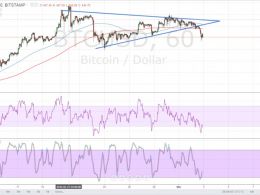
Bitcoin price might be in for a pullback opportunity to these inflection points before resuming its climb. Bitcoin Price Key Highlights. Bitcoin price recently made a strong rally and zooming in to the 1-hour chart shows potential correction levels. A bullish flag pattern can be seen on the longer-term time frames but it looks like buyers would need to wait for a pullback. Technical indicators are showing mixed signals at the moment, which suggests a possible short-term retracement on the ongoing uptrend. Technical Indicators Signals. The 100 SMA is above the longer-term 200 SMA on the....