Litecoin Price Technical Analysis For 08/01/2016 - Critical Upside Break
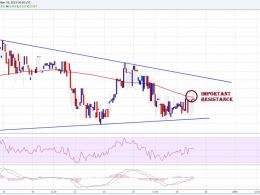
Yesterday, there were a couple of attempts by sellers to take Litecoin price down, but they failed. As a result, buyers stepped in and took the price higher. The most important point was the fact that the price managed to climb above a few critical resistance levels. First, there was a major bearish trend line on the hourly chart via the data feed from Bitfinex, which was broken during the upside drift. Moreover, the price also closed successfully above the 100 hourly simple moving average. A new weekly high was formed near $3.64 where the upside was stalled. There is a chance that the....
Related News
Litecoin price moved a few points higher to trade near the 100 simple moving average on the 2-hours chart (data feed from HitBTC). However, sellers defended the 100 MA successfully and prevented the upside move. There were more than two attempts to break it, but buyers failed to take the price higher. If we look at the technical indicators, then there are a few bullish signs. The 2-hours MACD is in the bullish zone, and the RSI is above the 50 level suggesting that there is a chance of an upside break.

Litecoin price fell further and traded towards our final sell target. Moving ahead, a short-term recovery is possible as the price is approaching a critical support. Litecoin price headed down yesterday, as seller remained in action and buyers failed to hold the downside break. Out long followed bearish trend line on the hourly chart (data feed from Bitfinex) continued to play a major role and ignited a solid downside move. As can be seen from the chart attached, there were more than 4 attempts to break the highlighted trend line and resistance area, but buyers failed.
Key Highlights. Litecoin price traded lower this past week as it failed to break an important resistance area of $3.40. A major support area of $3.30 was cleared by sellers, which is currently acting as a resistance (price feed from HitBTC). The 100 hourly simple moving average (price feed from Bitfinex) is also near the current levels, and preventing the upside move. Litecoin price is forming an ascending channel pattern that may act as a catalyst for the next move in the near term. Upside break likely? Litecoin price recently broke a critical support area of $3.30, but somehow managed to....
Key Highlights. Litecoin price after attempting a correction failed, and currently heading lower. The price breached a monster support area, which is signaling towards more declines ahead. Litecoin price clearing a critical support area is a warning sign to buyers and could ignite a downside move. Litecoin price solid run towards the upside failed around $8.98, as it traded lower. The downside was stalled around $3.24. It was a monster decline, as pointed in the previous weekly analysis. However, buyers made an attempt to take the price higher, but the upside was stalled just below the....

Litecoin price struggle to trade higher continues. It looks like it may head lower as the 4-hours chart is signaling a critical break. Intraday Support Level (HitBTC) may be at $$3.00. Intraday Resistance Level (HitBTC) where buyers could struggle can be at $3.15. Litecoin price struggle to trade higher continues, and it looks like it may head lower as the 4-hours chart is signaling a critical break. Litecoin price recently tested the $3.00 support area where it found buyers and corrected higher. However, it is facing a lot of hurdles on the way up. Looking at the 30-mins chart (data feed....