Bitcoin Price Weekly Analysis – BTC/USD Eyeing Crucial Break
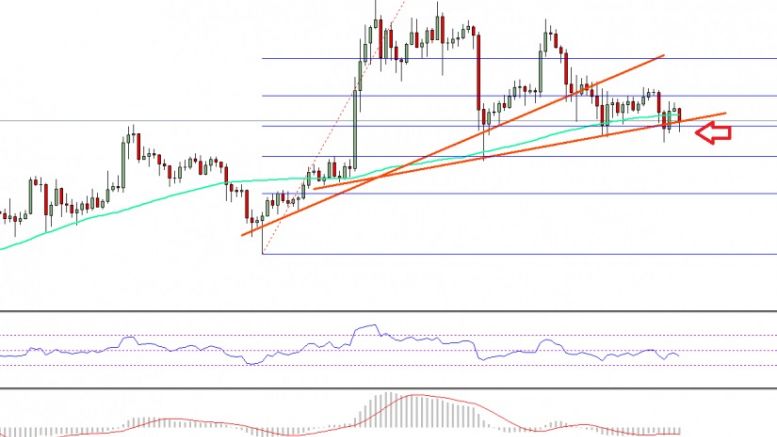
Bitcoin price traded positively this past week versus the US dollar, and currently the BTC/USD pair is eyeing a major downside move. Key Points. Bitcoin price traded positively this past week against the US Dollar to trade near $780. At the moment, the BTC/USD pair is attempting to break a bullish trend line formed on the 4-hours chart (data feed from SimpleFX). If there is a break and close in BTC/USD, there may be an increase in the downside pressure. Bitcoin Price Trend Line Support. There was a nice upside move in BTC price this past week, as it moved towards the $780 level against the....
Related News
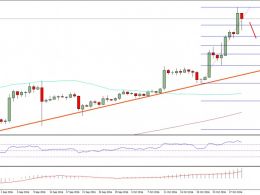
Bitcoin price surged high further as forecasted in the last weekly analysis of BTC/USD. Now can the pair trade towards the $750 level this upcoming week? Key Points. Bitcoin price gained a lot of traction this past week versus the US Dollar, and traded higher above $700. There is a monster bullish trend line formed on the daily chart (data feed from SimpleFX) of BTC/USD, which acted as a catalyst for an upside move. If the current momentum continues, there is a chance of a move towards $750. Bitcoin Price Upside Surge. In the last week analysis, I mentioned that Bitcoin price is in an....
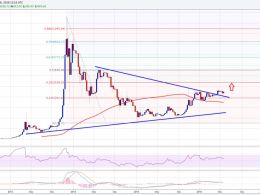
Bitcoin price looks bullish on a higher timeframe chart like the weekly chart, but the BTC bulls must capitalize and take it higher. Key Points. Bitcoin price may trade higher vs the US Dollar, as it looks it broke a major resistance area. There was a contracting triangle pattern formed on the weekly chart (data feed from Bitstamp) of BTC/USD, which was broken during the recent upside move. The price is now above the 100-weekly simple moving average, which is a positive sign for the BTC bulls. Bitcoin Price Crucial Break. Bitcoin price managed to slowly climb higher vs the US dollar, and....

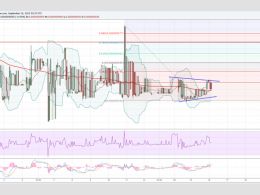
Key Highlights. Litecoin price dived recently sharply to trade near $3.01, but buyers appeared around the stated level to prevent losses. The price is below the 100 hourly simple moving average, which is a negative sign for buyers. Litecoin price after testing $3.00 support area moved higher, but it might struggle to gain pace for more gains. There was a sharp downside reaction in the Litecoin price this past week, as it dived towards an important support area of $3.00. It is where buyers appeared to prevent the downside and pushed the price higher. There is contracting triangle formed on....

The price of Polkadot (DOT) shows strength after bouncing from key support on the weekly chart against Tether (USDT). After Bitcoin (BTC) bounced from its monthly low of $19,000, this signaled a relief for other crypto altcoins including the price of Polkadot. (Data feeds from Binance) Related Reading: SOL Loses $40 After The Exploit – What’s The Next Support? Price Analysis Of Polkadot On The Weekly (1W) Chart From the chart, the price of DOT saw a weekly low of around $6.50, where it has formed support. The price has built more momentum as it faces resistance at $10. A break above....
Key Highlights. Dogecoin price continues to find bids around an important support area of 52.6. A crucial contracting triangle pattern is formed on the hourly chart, which might ignite a break moving ahead. Buyers are attempting for a break, and if they succeed we might witness gains in the near term. Dogecoin price is eyeing a break moving ahead with resistance around 54.0-5 Satoshis and support near 53.0 Satoshis. Triangle Break. The Dogecoin price recently traded close to the 52.5 Satoshis support area where buyers appeared to defend more downsides. Sellers tried many times to clear the....