
Bitcoin Price Technical Analysis for 12/11/2015 - Long-Term Trend Line Forming?
Bitcoin Price Key Highlights. Bitcoin price is still on the decline, with the corrective wave from the previous price rally not yet completed. A rising trend line can be drawn connecting the recent lows of bitcoin price action since the start of this year. Bitcoin price might make it all the way down to test the long-term rising trend line support before showing a bounce or resuming its climb. Dynamic Support at SMAs. The rising trend line could serve as the line in the sand for any corrective moves off the long-term uptrend, as a break below this level could send bitcoin price in a free....
Related News

Key Highlights. Dogecoin price looks like forming a short-term base near 32.2 Satoshis, as shown on the hourly chart (price feed from HitBTC). The price may bounce from the current levels, but could find resistance near 35.0 Satoshis. Selling rallies may be a good deal moving ahead as long as the price is below the mentioned resistance area. Dogecoin price may recover in the near term, but we cannot discard the fact that there is a lot of bearish pressure, calling for sell rallies idea. 35.0 Satoshis as Resistance. Dogecoin price found bids near 30-32.0 Satoshis, and currently attempting....
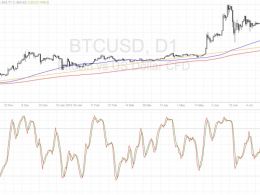
Bitcoin Price Key Highlights. Bitcoin price has been under a lot of bearish pressure recently but could be due for a bounce as it nears a long-term area of interest. On the daily time frame, it can be seen that price is moving above an ascending trend line that has been holding since November 2015. Price is still within the Fibonacci retracement levels so a continuation of the uptrend is a possibility. Bitcoin price sold off sharply in the past week but is currently testing a key support zone around several major inflection points. Technical Indicators Signals. The 100 SMA is safely above....
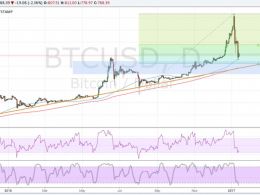
Bitcoin price is still hovering close to the long-term rising trend line but could be trying to resume its rally. Bitcoin Price Key Highlights. Bitcoin price has been trending higher on its longer-term time frames, moving above a rising trend line visible on the daily chart. Price recently tested the trend line support and made a bounce, which suggests that bulls are intent on keeping the uptrend intact. The rally is still finding legs but there are technical arguments for a continuation of the climb. Technical Indicators Signals. The 100 SMA is above the longer-term 200 SMA on this time....

Dash Price Key Highlights. Dash price failed to move lower, and found support around a critical trend line as highlighted in yesterday's analysis. The Double top pattern is still valid, as the price is below the resistance area. If there is a break above 0.0130BTC, then more gains are possible in the near term. Dash price acquiring bids around the bullish trend line is a positive sign for buyers looking ahead. Trend Line Proved Worth. Yesterday, we highlighted that there is a possibility of a double top pattern forming on the hourly chart which could result in a move lower. There was a....

Bitcoin’s price is undergoing a correction toward the long-term upward trend. For how long will this correction last, and at which point is the long-term upward trend most likely to continue? What has caused the start of this correction? One of the key long-term levels was near $760-80. A long-term downward trend has been forming along that price as far back as 2014. The price of $760-80 has become a key level. The placing of the correction level of the Fibonacci grid 38% has given more significance to that range. That’s why it could be called a historical maximum, which was later....