Bitcoin Price Technical Analysis for 04/22/2016 – Upside Breakout Pullback?
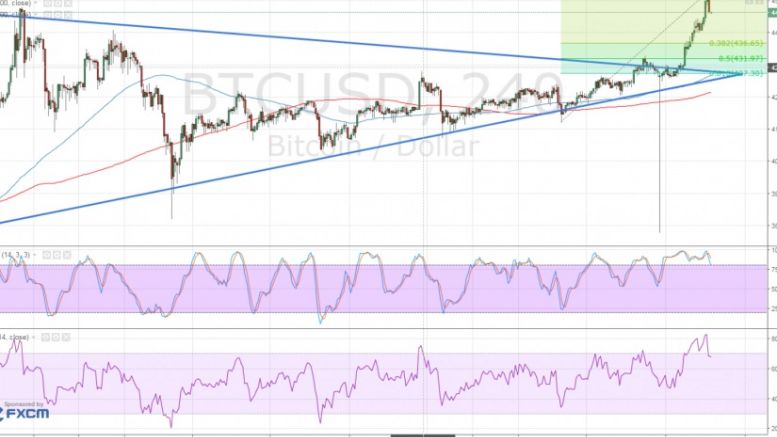
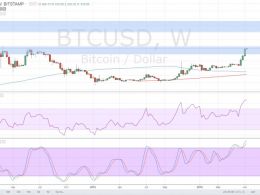
Bitcoin price is on track for a longer-term climb but bulls might need a retracement to gather more steam. The 100 SMA is still above the longer-term 200 SMA, confirming that the path of least resistance is to the upside. Also, the 100 SMA lines up with the broken triangle resistance, which might hold as support moving forward. Applying the Fibonacci retracement tool on the latest swing high and low shows that the 61.8% level lines up with the 100 SMA and triangle resistance. A large pullback could last until that area but a shallow correction could find support at the 38.2% Fib or $435....
Related News
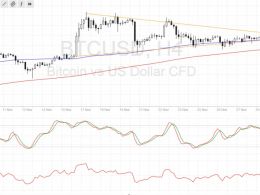
Bitcoin price followed through with its consolidation breakout and sustained its climb. Bitcoin Price Key Highlights. Following the recent upside breakout from the symmetrical triangle pattern, bitcoin price continued to climb as predicted in the earlier post. Price has now made its way to the triangle highs around $780 and is showing increased buying pressure to form new highs. Technical indicators are giving mixed signals at the moment, but it looks like the odds are in favor of more bullish action. Technical Indicators Signals. The 100 SMA is above the 200 SMA so the path of least....
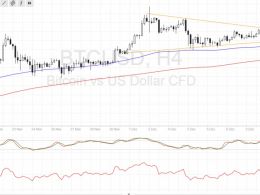
Bitcoin price broke out of its triangle consolidation pattern, indicating that bulls are ready to take control once more. Bitcoin Price Key Highlights. Bitcoin price was previously stuck inside a symmetrical triangle consolidation pattern as bulls and bears were in a tight race. Bulls eventually won out as price made another upside breakout, following the previous break higher on an earlier triangle formation. This puts bitcoin price on track towards testing the $800 handle, which might spur profit-taking once more. Technical Indicators Signals. The 100 SMA is above the longer-term 200 SMA....
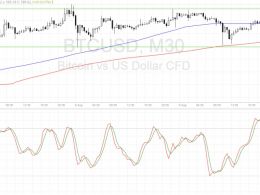
Bitcoin price is settling inside a range but technical indicators seem to be hinting at an upside breakout. Bitcoin Price Key Highlights. Bitcoin price has been moving sideways on the slowdown in volatility, stuck in a range between support at $575 and resistance at $590. Price appears to be bouncing off the top of the range once more, gearing up for another test of support. However, technical indicators are suggesting that a breakout could take place. Technical Indicators Signals. The 100 SMA is still above the longer-term 200 SMA on this time frame, signaling that the path of least....
Bitcoin price has shown strong upside momentum over the past few weeks and might be eyeing a test of these next ceilings. Bitcoin Price Key Highlights. Bitcoin price made another break higher over the weekend, indicating strong bullish momentum. Price is now testing another long-term area of interest around $700, at which either profit-taking or another upside breakout might be seen. Technical indicators are hinting that the rallies could pause but it would be helpful to look at the next potential resistance levels. Technical Indicators Signals. The 100 SMA is above the 200 SMA for now so....
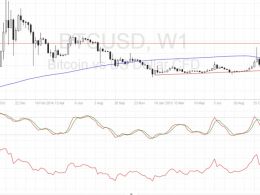
Bitcoin price made a strong upside breakout on Friday and could be in for a larger climb after a bit of correction. Bitcoin Price Key Highlights. Bitcoin price made a strong breakout from the $500 yearly highs, indicating its potential to keep the bullish run going. Zooming out to the longer-term weekly chart shows the next possible resistance levels. However, technical indicators are hinting that buyers are feeling exhausted and that a correction might be due. Technical Indicators Signals. The 100 SMA is above the longer-term 200 SMA on the weekly chart so the path of least resistance is....