Bitcoin Price Technical Analysis for 06/21/2016 – Watch These Correction Levels
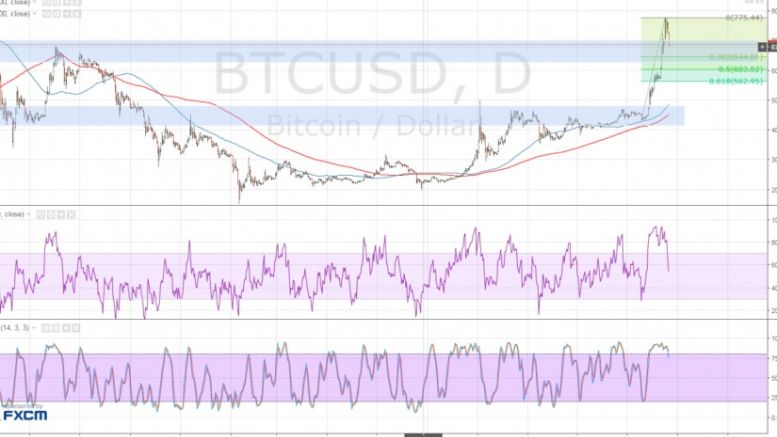
Bitcoin price gave in to overbought conditions and is in the middle of a large correction to an area of interest. Bitcoin Price Key Highlights. Bitcoin appears to have hit a ceiling at the $775 mark, making a break below a short-term consolidation pattern and moving towards the nearby support. Price is now trading below the $700 mark and could head further south until $650, which is close to the 38.2% Fibonacci retracement level and a former resistance. A bounce off this correction area could allow bitcoin price to resume its climb to the recent highs and beyond. Technical Indicators....
Related News
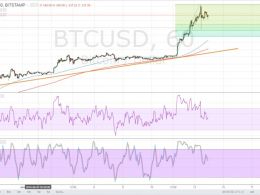
Bitcoin price looks ready to make a correction from its recent rally, giving buyers a chance to hop in the uptrend at better levels. Bitcoin Price Key Highlights. Bitcoin price recently made a strong rally but it looks like bulls are booking profits. This could offer a nice opportunity to enter on a short-term correction from the sharp climb. Using the Fibonacci retracement tool on the latest swing low and high on the 1-hour time frame shows potential entry points. Technical Indicators Signals. The 100 SMA is above the longer-term 200 SMA so the path of least resistance is to the upside.....

As we warned, Bitcoin’s price against the US Dollar fell, breaking both levels of support $440 and $430. A long-overdue correction and the hesitancy of buyers lowered Bitcoin. Moreover, yesterday the Dollar strengthened its positions against other major currencies. The dramatic collapse of the price to the levels of $445 and $427 occurred during the American session and the beginning of the Asian session. The price of Bitcoin follows the path of least resistance – sellers will try to bring the situation under control and to lower the price to $420. If they succeed, the Bears will open the....
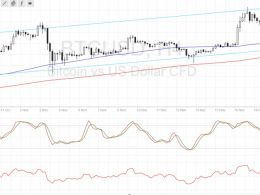
Bitcoin price is pulling back from its ongoing uptrend, offering bulls a chance to go long at cheaper levels. Bitcoin Price Key Highlights. Bitcoin price retreated upon testing its yearly highs, allowing the correction to materialize as predicted in the previous post. An ascending channel can be seen on the 4-hour bitcoin chart, and price is approaching the floor. Technical indicators are showing that the climb is likely to resume rather than reverse. Technical Indicators Signals. The 100 SMA is above the longer-term 200 SMA on the 4-hour chart, confirming that the path of least resistance....

Bitcoin Price Key Highlights. Bitcoin price recently made a strong upside break from a consolidation pattern, indicating that buying pressure is building up and that an uptrend might take place. A bit of hesitation can be seen right now, though, so a correction to the short-term Fib levels might be needed before more bulls come out to play. Bitcoin price could retreat to any of the Fibonacci retracement levels marked on the 1-hour time frame before resuming is climb to the previous highs or beyond. Technical Signals Favor Rallies. Even though a bit of selling pressure could come into play....
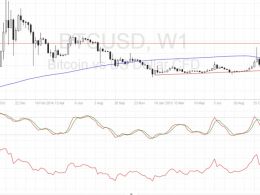
Bitcoin price made a strong upside breakout on Friday and could be in for a larger climb after a bit of correction. Bitcoin Price Key Highlights. Bitcoin price made a strong breakout from the $500 yearly highs, indicating its potential to keep the bullish run going. Zooming out to the longer-term weekly chart shows the next possible resistance levels. However, technical indicators are hinting that buyers are feeling exhausted and that a correction might be due. Technical Indicators Signals. The 100 SMA is above the longer-term 200 SMA on the weekly chart so the path of least resistance is....