
TA: Bitcoin Price Below 100 SMA Could Spark Bearish Reaction
Bitcoin is slowly moving lower below $24,500 against the US Dollar. BTC could drop in the short-term if it stays below the 100 hourly SMA. Bitcoin started a downside correction after it failed to settle above $25,000. The price is now trading below the $24,500 level and the 100 hourly simple moving average. There was a break below a key bullish trend line with support near $24,300 on the hourly chart of the BTC/USD pair (data feed from Kraken). The pair could extend losses below the $23,780 and $23,500 support levels in the short-term. Bitcoin Price Breaks Support Bitcoin price attempted....
Related News

Key Highlights. Litecoin price continued to move lower, as there was a lot of bearish pressure and buyers struggled to take the price higher. There is a bearish trend line formed on the hourly chart, which is preventing gains in the near term. Litecoin price traded lower and fell close to $2.40 before finding buyers to protect additional losses. There was a sharp downside reaction this past week, as the price dived towards $2.40. However, there was a nasty reaction noted around the mentioned area, as buyers pushed the price higher. Now, there is a bearish trend line formed on the 4-hours....

Bitcoin Price Key Highlights. Bitcoin price continued to weaken during this past week as sellers remained under control and pushed the price lower. The price already declined towards 220.00, and the bearish pressure increase more losses are possible. Bitcoin price remained under the bearish pressure this past week, which ignited a downside reaction. We highlighted this past week that the price could continue to trade lower, and it is what happened. There was a monstrous decline in the Bitcoin price, as sellers were in control throughout the week. We also highlighted a bearish trend line....
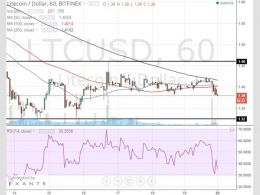
After making a low at 1.32 last week, litecoin has been in consolidation. The 1H chart shows the narrow consolidation range between 1.32 and 1.46. Litecoin (LTCUSD) 1H Chart April 20. Here are some observations from the 1H chart:1) The market has been relatively quiet over the weekend, but after price met with the 200-hour simple moving average (SMA), there was a bearish reaction. This shows that bears are in control. 2) The RSI shows a market in consolidation. It is now heading to 30, which could be a sign that the market is reviving the bearish momentum. If the RSI tags 30, and holds....
Dogecoin Price Key Highlights. Dogecoin price moved lower and broke the all-important 50.0 Satoshis area for a new low. There was a break below the support trend line, as forecasted in yesterday's post. The downside reaction was in the form of a spike, as the price traded towards 47.0 Satoshis before recovering. Dogecoin price moved lower and traded below a critical support area of 50.0 Satoshis, which is a bearish sign. More Losses ahead? Yesterday, we mentioned that there is a chance of a break below 50.0 Satoshis, as there were many bearish signs noted on the hourly chart. The price did....

Key Highlights. Potcoin price continued to trade lower, as there is a bearish trend line on the hourly chart acting as a hurdle. The price has a major resistance formed around 0.00000242BTC where buyers might struggle. The Potcoin price is below the 100 hourly simple moving average, which is a bearish sign. Potcoin price looks set for more declines, as the price is under the bearish pressure which may increase moving ahead. Importance of 100 MA. There was a downside reaction in the Potcoin price recently, which took it towards the 0.00000227BTC level. Somehow, buyers appeared around the....