
Bitcoin Analysis: Week of Aug 3 (Intro to Candles)
In last weeks post we concluded with the following statement: Today we will see if we need to re-evaluate this view going into next week. First let’s take a look at the latest weekly chat: Our charts are conflicting; the shorter daily chart is implying continued bearish pressure, as the bullish trend line was broken this week. The longer-term weakly chart on the other hand is not suggesting anyone should panic just yet. Watch for a pull back to the US$500 to US$530 zone while still keeping your eye on the target of US$750. Once one of these zones is approached we would look to re-evaluate....
Related News

In last week’s post we concluded with the following statement: Now that the price has reached our support target of US$500-530 zone where do we stand now? Lets take a look at the weekly chart. “The odds, however, favor more downside back to the base of the triangle at US$560 and breaking below that should take us down into the US$500-530 zone where the Fibonacci’s will have a chance to create a healthy reversal.” The comment on the 61.8% Fibonacci retracement has been changed to indicate we have reached this critical support point. An additional trend line has been added that uses the....

In the most recent Mid-Week post, which will occasionally be published due to unexpected or severe moves in the market, we concluded with the following statement: So lets go over what happened. The price remained above the established low of US$442, which means the Long Term Up-Trend is still intact (more on that later). This US$440-450 downside target was mentioned as the less likely scenario in the Week of Aug 17 Price Review. As a trader, all possible scenarios are always considered, so that when they happen, there is a plan and you do not end up in ‘panic mode’. The bounce off of this....
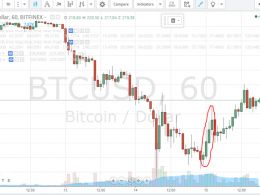
The price of Bitcoin started the day by rising and scoring higher highs above the $200 support point. The 1 hour (BTC/USD) Bitfinex chart from tradingview.com showed 4 open (green) candles before a closed (red candle was recorded (look at the candles inside the red cloud on the below chart) which, as we mentioned yesterday, is a confirmation of an intermediate degree price uptrend. By observing the 1 day (BTC/USD) Bitfinex charts from tradingview.com, we can identify a

In last weeks post we concluded with the following statement: Friday Aug 1st started out as an impressive day yet sold off near the end. As a trader of the Fiat Financial Markets it would have been reasonable to pull the trigger and try and take advantage of the upward momentum, but keep in mind, the medium term trend is still down and the trader should have realized within a few days that the breakout back to US$625 is not imminent. Let us now take a look at the long-term view and see where we stand. Friday’s close will help guide us whether we can once again approach the 50% Fibonacci....

Bitcoin has been consolidating since hitting a low around 166. Price has rebounded above 300 briefly, and then retreated. Still, BTCUSD has been hanging onto the consolidation mode in what appears to be a triangle. With price action already so close to the triangle apex, a breakout is imminent, but it will not be of much significance by itself. Let's see what other technical clues we will need. Bitcoin (BTCUSD) 24/2/2015 Daily Chart. The daily chart shows that since price tagged 300, bearish candles have dominated. In fact, last Friday's bearish candle combined with the previous 4 daily....