Bitcoin Price Technical Analysis for 23/1/2015: Increasing Highs
Bitcoin price is continuing to make higher highs which confirm the bullish momentum of the market throughout the past few days. We have been adding up the bullish signals via our daily analysis articles this week. Bitcoin Price Technical Analysis. By observing the 1 day Bitfinex BTC/USD charts from tradingview.com (look at the below chart), we can see that bitcoin price closed at increasing highs on 2 successive days. At the time of the writing of this article, the price exceeded $233 and is expected to increase even more to surpass yesterday's closing price. By plotting the MACD on the....
Related News

Bitcoin rises more than 2 percent to $430.21, nearing our year-end target of $440. In the previous price technical analysis A No Trade Market, we mentioned that an increasing MFI often causes price appreciation, and we are witnessing just that. The question now is: Would bitcoin be able to extend the gains or will it retrace its steps? Let us try to predict this with the help of technical analysis conducted on the 240-minute BTC-USD price chart. Bitcoin is well poised to increase its duration inside the $400-440 range, at least for the next couple of sessions. There is a high probability....

Bitcoin briefly topped $250 for the first time since August 19, 2015, hitting a fresh monthly high of $250.09. We concluded the previous Bitcoin price technical analysis Retreats From Monthly Highs on a positive note saying that market participants should not be concerned about the drop and instead go long in Bitcoin near $242 for a target of $250. As can be seen, Bitcoin hit an intraday low of $242.82 before meeting the said target. Bitcoin is currently trading at $248.81, up 1.92 percent. And yes, we stand by our long call! bitcoin price chart. Below are the latest technical....

I will resume writing a daily LTC price technical analysis starting from today, so throughout this article, I will try establishing some key resistance and support points that would help us read through the charts and detect clues that can predict future price movements. Last week, LTC price surged to exceed $4 on the 31st of October. The bullish wave started a day earlier than Bitcoin's surge and Litecoin's price rose from $3 to around $3.72 last Sunday. However, as Bitcoin's price rose above the $340 resistance level, LTC also continues to print higher highs. Bulls in Control On 1 Day....

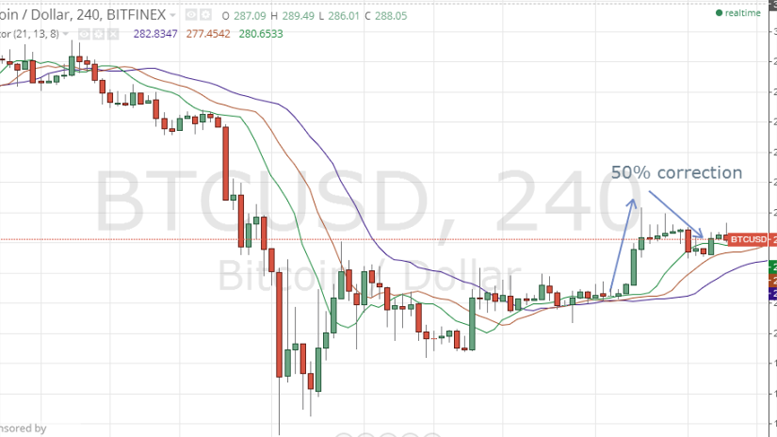
Bitcoin price continued rising as the market's buying volume is increasing constantly. A high of around $280 was printed earlier today and if the current bullish momentum continues and bitcoin price exceeds $284, it will face no considerable resistance on its way up to $320. By studying the 4 hour Bitfinex (BTC/USD) charts from tradingview.com, keeping the same Fibonacci retracement fan we created during yesterday's analysis and plotting the William's Alligator indicator accordingly (look at the below chart), we can notice the following: Bitcoin price is continuing to record higher highs....

Bitcoin is teetering yet again as bulls struggle to take the currency north of $300. The strength in the US dollar in the anticipation of the interest rate hike is also adding to their troubles. The wait to reach new highs in 2015 may get prolonged if bulls fail to up the ante soon. As can be seen from the 240-minute BTC/USD price chart above, Bitcoin at $292.86 is trading close to its two major support lines, Support Line 1 and Support Line 2. Both hold immense value in the short term as the price has marched up by retesting them several times. Unless the price crosses the two trendlines....