
Bitcoin Price Technical Analysis for 15/2/2015 - Out of the Blue!
Bitcoin price dropped today to a low of $228.45. It seems that the buying power of the market didn't succeed in maintaining the price above the $256 support level for a long time. By looking at the 1 hour Bitfinex (BTC/USD) chart from tradingview.com and plotting the 20 day EMA on top of the chart, we can see how bitcoin price exhibited a rather steep drop from $268.34 to around $228.45 today. The bearish wave seems to be gaining strength as shown by the 7 successive red bearish candlesticks on the 1 hour chart. Also, the price has been trading below the 20 day EMA during most of today's....
Related News

Bitcoin price continued rising today and the market's buying power pushed the price up to a high of $258.92. At the time of my writing of this analysis, bitcoin price is testing the $256 resistance level. By studying the 1 hour Bitfinex (BTC/USD) chart fromtradingview.com and drawing a horizontal line across the $256 resistance/support level (look at the below chart), we can notice that on the 26th of January 2015, bitcoin price exceeded $300. We can also note that the price didn't face any support all through the way from $300 down to $256. Oppositely, as bitcoin rises above $256, it will....

As of today, I will start doing a daily dogecoin price technical analysis, so it is rather wise to set up resistance and support levels that will guide us through our analysis during the upcoming couple of weeks. Dogecoin price increased from 59 satoshis to 61 satoshis yesterday. Although the price dropped to 56 yesterday, the bears didn't manage to keep the downtrend rolling to keep the price down. Yesterday's market behavior proves that the 52 satoshi level is supporting the price well, as shown by the long downwards shadows of the candlesticks corresponding to today's and yesterday's....
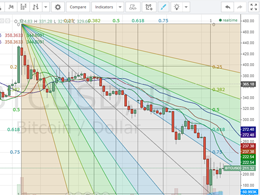
The price of bitcoin started the day by rising from $210 to around $219 and since then, it started a repetitive pattern by oscillating between $207 and around $215. By plotting the Fibonacci retracement fan on the 1 day Bitfinex BTC/USD charts from tradingview.com (look at the below chart), we can see the price advancing towards the 0.75 fan line, while gaining support at the 1.0 fan line. Bitcoin traded around $212 at the time of writing of this article and the market seems to me moving sideways in an attempt to correct the price. By plotting the MACD curve on the 1 hour Bitfinex....

Bitcoin price is pushing toward its three-month resistance ceiling. Technical and sentiment analysis argue for a return to decline, and fundamental analysis shows that Bitcoin’s value is more fragile than many realize. Friday’s technical analysis concluded that the outlook for bitcoin price is bearish while price fails to break above the prevailing resistance ceiling (blue down-sloping line in the chart). Going forward, technical analysis will be informed by the position of price in relation to this ceiling: if the market can successfully trade price above it, we can expect continuing....

Bitcoin price has, during the past three days, formed a series of lower highs and higher lows in a pattern that resembles the consolidation prior to a decline. There are technical indications that a pull lower is on the cards, but it may not get far. This analysis is provided by xbt.social with a 3-hour delay. Read the full analysis here. Not a member? Join now and receive a $29 discount using the code CCN29. Bitcoin Price Analysis. Time of analysis: 15h00 UTC. Bitfinex 1-Hour Chart. From the analysis pages of xbt.social, earlier today: The Bitfinex 1-hour chart shows the decline since the....