Dogecoin Price Technical Analysis for 19/2/2015 - Lazy Candles
Dogecoin price ranged between 58 and 62 satoshis throughout yesterday's trading sessions. Although today the price dropped to 56 satoshis, it recorded a high exceeding 63 satoshis before falling again to 58 satoshis at the time of writing of this article. By observing the 1 day (DOGE/BTC) chart from tradingview.com and plotting the On-Balance Volume (OBV) oscillator (look at the below chart), we can notice the following: Since the 25th of January, dogecoin price has been trading between 56 and 66 satoshis as shown by the trend lines on the below chart. The OBV oscillator curve is sloping....
Related News

As of today, I will start doing a daily dogecoin price technical analysis, so it is rather wise to set up resistance and support levels that will guide us through our analysis during the upcoming couple of weeks. Dogecoin price increased from 59 satoshis to 61 satoshis yesterday. Although the price dropped to 56 yesterday, the bears didn't manage to keep the downtrend rolling to keep the price down. Yesterday's market behavior proves that the 52 satoshi level is supporting the price well, as shown by the long downwards shadows of the candlesticks corresponding to today's and yesterday's....

Bitcoin has been consolidating since hitting a low around 166. Price has rebounded above 300 briefly, and then retreated. Still, BTCUSD has been hanging onto the consolidation mode in what appears to be a triangle. With price action already so close to the triangle apex, a breakout is imminent, but it will not be of much significance by itself. Let's see what other technical clues we will need. Bitcoin (BTCUSD) 24/2/2015 Daily Chart. The daily chart shows that since price tagged 300, bearish candles have dominated. In fact, last Friday's bearish candle combined with the previous 4 daily....

The Dogecoin price surged near 1.5% against the BTC during the March 11th trading session, thereby establish smaller bullish corrections in an already bearishly-biased market. The market however continues to face strong upside risks that, if tested, could really pulldown price back to invalidate the currency near-term bull sentiment. Following is the elaboration of this theory. As you can notice the DOGE/BTC 4H Chart above, sponsored by Trading View, the Dogecoin price has clearly formed new higher highs in order to test the 61.8% retracement - aligning with 54. Just after that, you could....
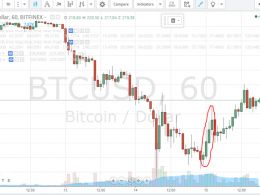
The price of Bitcoin started the day by rising and scoring higher highs above the $200 support point. The 1 hour (BTC/USD) Bitfinex chart from tradingview.com showed 4 open (green) candles before a closed (red candle was recorded (look at the candles inside the red cloud on the below chart) which, as we mentioned yesterday, is a confirmation of an intermediate degree price uptrend. By observing the 1 day (BTC/USD) Bitfinex charts from tradingview.com, we can identify a
Dogecoin has undergone a massive correction of roughly 10% in the past 24 hours, with the price nose-diving from 49.8 satoshis to 45.1 satoshis. As a result of this fall, Dogecoin has neared the floor of 43 satoshis, which if cracked, could lead to a severe collapse in the price. But, will it? Let us find out with the help of technical analysis below. Technical analysis implemented on the 240-minute Dogecoin/Bitcoin price chart reveals that bears are pouncing on every opportunity to jettison Dogecoin en masse. The support of 43 satoshis may well give way to a lower ground, if bulls....