
Bitcoin Price Technical Analysis for 6/3/2015 - Gearing Up!
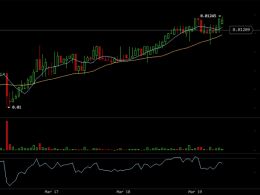
Bitcoin price increased yesterday to print a high of around $285, yet today's trading started by an increase in the selling volume which pulled the price downwards to around $271 at the time of writing of this analysis. It seems that bitcoin price will resume rising within a few hours to attempt approaching the $300 level. By examining the 4 hour Bitfinex (BTC/USD) chart from tradingview.com and plotting the William's Alligator indicator accordingly (look at the below chart), we can conclude the following: Since the 27th of February, bitcoin price has been closing on higher lows every day.....
Related News

The Christmas isn’t turning out to be merry for Bitcoin. The cryptocurrency is struggling near the overhead resistance of $465. It is now trading 1.28% lower at $450.89, raising concerns that the market participants might pull out their funds in the holiday season. As a result, several technical indicators are also showing declines. We advised in the previous Bitcoin price technical analysis Target Achieved that traders should book at least partial profits in their long positions. And for today’s analysis, we will again be using the 4-h BTC-USD price chart from BITSTAMP.

Bitcoin rises more than 2 percent to $430.21, nearing our year-end target of $440. In the previous price technical analysis A No Trade Market, we mentioned that an increasing MFI often causes price appreciation, and we are witnessing just that. The question now is: Would bitcoin be able to extend the gains or will it retrace its steps? Let us try to predict this with the help of technical analysis conducted on the 240-minute BTC-USD price chart. Bitcoin is well poised to increase its duration inside the $400-440 range, at least for the next couple of sessions. There is a high probability....
Looking at the darkcoin price chart from Cryptsy reveals that the cryptocurrency might be in for more upside, after recently bouncing off support at 0.0100. On its 1-hour time frame, price is continuing to climb higher, with technical indicators suggesting further gains: Shorter-term moving average is treading above the longer-term moving average, confirming that an uptrend is in play. The moving averages are edging further apart, which suggests that the trend is getting stronger. Price just recently broke past an area of interest and pulled back for a quick retest of....

In the previous Bitcoin price technical analysis Rebounds, we discussed how the cryptocurrency was erasing the losses for the past week. But, the entire positivity was put to rest over the weekend as bears made a comeback and long positions were fast liquidated at the slightest hint of a pullback. Bitcoin, which is now trading at $227.93, has once again come closer to its important buying interest zone of $220-225. As the price decline has pushed the price closer to its crucial support, market participants may also be factoring in a breach of support this time, but I would recommend....
Bitcoin price is stuck in a tighter consolidation pattern, which could set the tone for an even more explosive breakout. Bitcoin Price Technical Analysis. Bitcoin price is starting to form a new ascending channel after its previous breakdown. The consolidation is noticeably tighter these days, which suggests that price could be gearing up for a strong breakout. The US elections would likely have a strong impact on financial market sentiment and dollar price action. Technical Indicators Signals. The 100 SMA just crossed below the longer-term 200 SMA so the path of least resistance is now to....