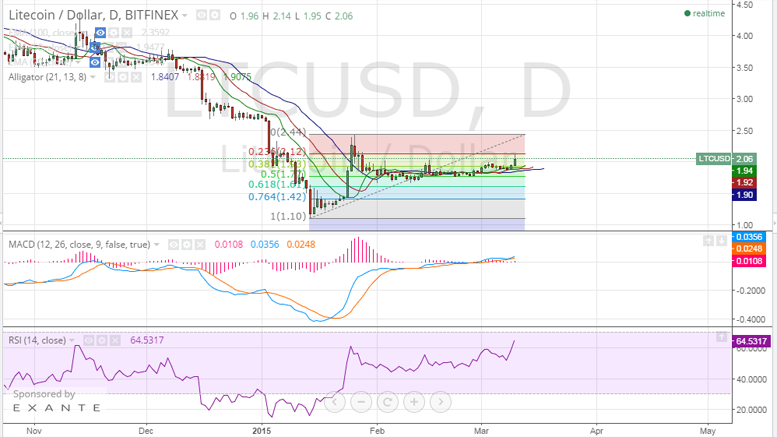
Litecoin Price Technical Analysis for 10/3/2015 - Nudging Resistance!
Litecoin price continued rallying today to print a high of around $2.14 a couple of hours before writing this analysis. Although the price rose to test the 23.5% Fibonacci retracement level at $2.12 today, the following hours will decide whether or not litecoin price will manage to break through this essential resistance level. By studying the 4 hour Bitfinex (LTC/USD) chart from tradingview.com, plotting the William's Alligator indicator and drawing Fibonacci retracement levels along a trend line that extends between the low reached on the 14th of January at around $1.10 and the high....
Related News

Litecoin rises 2.92 percent to $3.098 as it breaks away from the consolidation phase which lasted for 7 consecutive days. This is also the highest closing level for Litecoin in over a month. The rise in Litecoin could also be partly attributed to a strong surge in Bitcoin on the back of a strong momentum breakout. Helped by the price jump, Litecoin is now in the sniffing distance of a crucial overhead resistance which we discussed in the previous Litecoin analysis In a Fix? Below are the latest technical considerations taken from the daily LTC-USD price chart. Helped by the price jump,....

In the previous Litecoin price technical analysis Flat Action, we discussed that if Litecoin fails to cross the resistance posed by the level of $3.160, it runs the risk of entering into a range. As can be seen, Litecoin has plummeted 4.44 percent to $2.907 as traders resorted to profit taking near the resistance. Another factor weighing on Litecoin is the weakness in the Bitcoin market. However, the good news is that Bitcoin is now close to its support level of $235. Values from the technical indicators overlaid on the daily LTC-USD price chart also suggest that there is an increased....
Following the lead of Bitcoin, Litecoin has gained 5.69% over the weekend. The advance has also brought the price closer to its resistance zone, beyond which Litecoin may witness a massive rally. Litecoin is currently trading at $3.047. In my previous analysis titled This Market is not for the Greedy!, I had suggested that Litecoin be shorted by keeping a strict stop-loss above $2.980. Those who would have followed this advance would have minimized their losses significantly. Technical analysis of the 240-minute LTC-USD price chart points to a probability that the cryptocurrency may, in....

Starting from today, I will be posting a daily litecoin price technical analysis, so I guess it's better to establish key resistance and support levels that will be a base for our future analyses during the upcoming couple of weeks. Litecoin price increased to score a high of $2.04 yesterday, before dropping to a low of $1.79. By examining the 1 hour (LTC/USD) and (BTC/USD) charts, we can clearly see that litecoin price is mirroring what is happening on the bitcoin charts. By studying the 1 day Bitfinex (LTC/USD) chart from tradingview.com and plotting the Fibonacci retracement fan along a....

Litecoin falls 1.47 percent to $3.075 after kissing the resistance at $3.130. In the previous Litecoin price technical analysis, we said that Litecoin could leapfrog to higher levels on consistent support from the buyers, but what we have got instead is a bout of profit booking which once pulled down the price to an intraday low of $3.050. But can this decline prove fatal to Litecoin? Will the crucial support of $3.000 be breached? Let us try to find that out by conducting a technical analysis on the daily LTC-USD price chart. Litecoin Chart Structure - As can be seen, the higher top,....