Dash Price Technical Analysis - Triple Top and Trend Line Support
Key Highlights. Dash price forming an interesting pattern, which is a contradicting and divergence signal. There is a Triple top pattern is formed, which is a bearish sign. At the same time, there is a bullish trend line formed (as highlighted in yesterday's post), which is acting as a major barrier for sellers. Dash price is heading towards a major break, as there are several breakout patterns forming on the hourly chart. Triple Top Pattern. A few days ago, we highlighted a double top pattern on the hourly, which stands valid till date. Now, there is a triple top pattern forming, as there....
Related News

Dash Price Key Highlights. We highlighted yesterday that the Dash price might have completed a 5-waves up pattern and could move lower in the near term. There was a break lower, as the price moved below a major trend line support area to test 0.0124BTC. The Triple top pattern formed was valid and helped sellers to gain control. Dash price finally moved lower and cleared a critical support area to open the doors for more losses. Downside Break. As mentioned in yesterday's post, we highlighted a couple of important patterns and were waiting for a break in the Dash price. There was a break....

Dash Price Key Highlights. Dash price failed to move lower, and found support around a critical trend line as highlighted in yesterday's analysis. The Double top pattern is still valid, as the price is below the resistance area. If there is a break above 0.0130BTC, then more gains are possible in the near term. Dash price acquiring bids around the bullish trend line is a positive sign for buyers looking ahead. Trend Line Proved Worth. Yesterday, we highlighted that there is a possibility of a double top pattern forming on the hourly chart which could result in a move lower. There was a....
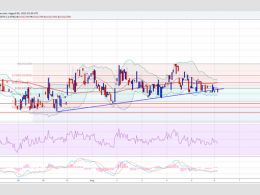
Dash Price Key Highlights. Dash price looks like completed a 5-waves up pattern and might head lower in the near term. There is a Triple top pattern formed (as highlighted yesterday), which could push the price lower. Besides, there is a bullish trend line formed, which must be cleared for more losses in the near term. Dash price might have created a short-term top, as there is a wave sequence completed on the hourly chart. 5-Waves Pattern. As mentioned in yesterday's post, we are waiting for a break in the Dash price. There are a couple of important things formed on the hourly chart,....

Dash Price Key Highlights. As highlighted in the weekly analysis, the Dash price completed a sell pattern and moved lower. More losses are likely, as sellers remain in control and look to take the price lower. A bearish trend line is formed, which if broken might call for a change in the trend. Dash price continued to weaken and might move further lower as long as sellers remain in control. Trend Line Resistance. As anticipated earlier there was a major downside reaction in the Dash price, as it fell below a major support area of 0.0120BTC which ignited a sell rally. The price traded as....
Dash Price Key Highlights. Dash price traded higher and managed to clear a major bearish trend line as highlighted in yesterday's analysis. However, buyers failed to hold gains, as there was a failure around 0.0119BTC. 0115BTC holds the key in the near term, as it acted as a support on many occasions. Dash price is testing a major support area, which must hold if buyers want to prevent downsides. Where is the price heading next? We highlighted a bearish trend line on the hourly chart yesterday, and were anticipating a break Intraday. There was a break higher noted, as the price breached....