Dash Price Technical Analysis - Flag Pattern
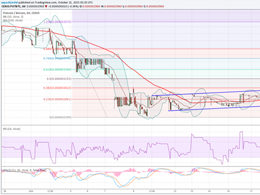
Dash Price Key Highlights. Dash price moved back lower once again and looks set for a retest of the last low of 0.0111BTC. There is a flag pattern formed on the hourly chart, which might cause a break in the near term. The price is below the 100 hourly moving average, signaling more losses ahead. Dash price after spiking higher found resistance around 0.0121BTC and traded lower one more time. Retest of lows? We highlighted in yesterday's post that the Dash price moved above the 100 hourly simple moving average, but the move was not convincing. As a result, there was a downside reaction....
Related News

Dash Price Key Highlights. Dash price after trading lower managed to find buyers around 0.0111BTC and currently moving higher. There is yet another flag pattern formed on the hourly chart, which might act as a catalyst for the next break in the near term. There lies a major resistance around 0.0120BTC, which must be cleared for more gains moving ahead. Dash price is forming a breakout structure on the hourly chart, which might set the path for the next move. Flag Pattern. Our previously highlighted flag pattern formed on the hourly chart was successful and opened the doors for more gains.....

A bull flag pattern resembles a flag on a pole and appears when a cryptocurrency is experiencing a significant price rise. Many security price forecasters use technical analysis, sometimes referred to as charting. However, they opt to reject the efficient markets hypothesis (EMH) altogether. The efficient markets hypothesis (EMH), also called the Random Walk Theory, is the idea that current securities prices accurately reflect the information about the firm’s value. Therefore, it is impossible to make excess profits using this information, or gains that are greater than the overall market.....
Dash Price Key Highlights. Dash price continued to move higher and looks set for more gains in the near term. As highlighted yesterday there is a flag pattern formed on the hourly chart, which is still in play and the price is moving inside it. A major hurdle around 0.0120BTC continue to stall the upside move, and must be cleared for more gains. Dash price continued to move inside the flag pattern as buyers remained in control in the short term. Pattern Continuation. We highlighted yesterday a flag pattern forming on the hourly chart, which continued to act as a catalyst for buyers. There....
Potcoin Price Key Highlights. Potcoin price continued to trade inside a flag pattern as highlighted in one of the recent technical analysis. Both buyers and sellers seem to be struggling to take the price in one particular direction, which created a range inside the flag pattern. A few technical indicators are pointing towards more losses and a break below the flag pattern. Potcoin price is trading inside a range and it looks like heading towards a break, waiting for a catalyst. Break Down? As mentioned in the previous analysis, there was a sharp decline noted in the Potcoin price which....

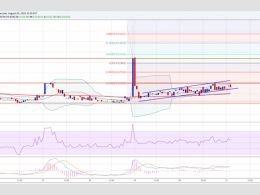
Dash Price Key Highlights. Dash price spiked higher sharply to register a new weekly high of 0.0147BTC where it found sellers. There was a flag pattern formed on the hourly chart, as highlighted yesterday which was breached to set the tone for an upside move. The price failed completely around 0.0147BTC, reversed more than 75% of gains. Dash price climbed higher sharply Intraday, but failed to hold gains and traded back lower. Failed attempt? We highlighted in yesterday's post that the Dash price could surge higher, as there was a flag pattern formed on the hourly chart. There was a break....