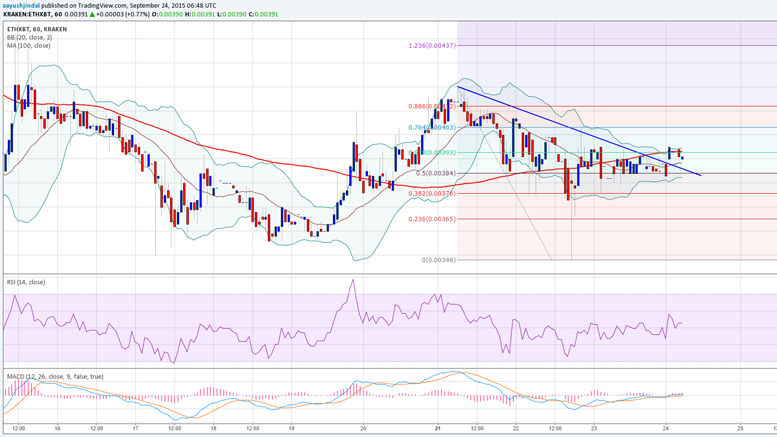
Ethereum Price Technical Analysis - Can This Be a Real Break?
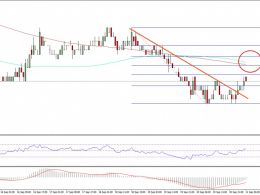
Ethereum Price Key Highlights. Ethereum price finally managed to break an important resistance around 0.00390BTC-0.0040BTC. It also cleared a bearish trend line formed on the hourly chart, which can be seen as a positive sign. The only question is whether this is a real break or not and can the price continue trading higher. Ethereum price spiked higher Intraday, and broke a resistance trend line as highlighted in yesterday's post. Can it be broken? The Ethereum price after struggling for some time to break a crucial bearish trend line formed on the hourly chart managed to gain traction.....
Related News
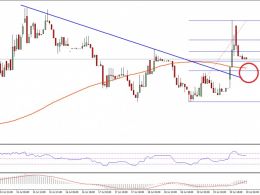
Ethereum price traded down near $7.0 where buyers appeared. Currently, it looks like there is a chance of ETH/USD breaking higher in the short term. Ethereum price ETH made a perfect bottom near $7.0. I highlighted in yesterday’s analysis that there is a chance of ETH/USD moving down towards $7.0, which can then produce a bounce. The price did test the mentioned level and moved higher later. There was a nice upside reaction, signaling more gains in the near term. ETH/USD is currently attempting to break a bearish trend line on the hourly chart (data feed via Kraken), which is also....
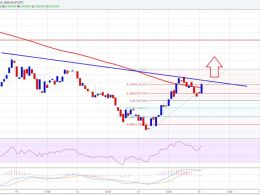
Ethereum price traded higher intraday, and looking at the current technical indicators it looks like it may trade further higher. Key Highlights. Ethereum price managed to move higher against the US Dollar and broke a major resistance area. Yesterday’s highlighted bearish trend line on the hourly chart (data feed via Kraken) of ETH/USD was broken during the recent upside ride. The price is now above the 100 hourly simple moving average, which is a positive sign for the bulls. Ethereum Price Buy. Ethereum price ETH surged higher against the US Dollar and posted a critical break intraday (as....

Ethereum Price Key Highlights. Ethereum price is slowly trending higher on its 1-hour chart, after having completed a pullback bounce and resuming its trend. Price is moving inside a short-term rising channel and is currently testing the resistance near the 0.00300 major psychological mark. Ethereum price could be due for a selloff back to the channel support before the ongoing climb resumes. Buyers Need a Break. Technical indicators seem to be suggesting that the recent rally is overdone, with stochastic already turning down from the overbought zone and indicating a return in bearish....
Potcoin Price Key Highlights. Potcoin price continued to trade inside a flag pattern as highlighted in one of the recent technical analysis. Both buyers and sellers seem to be struggling to take the price in one particular direction, which created a range inside the flag pattern. A few technical indicators are pointing towards more losses and a break below the flag pattern. Potcoin price is trading inside a range and it looks like heading towards a break, waiting for a catalyst. Break Down? As mentioned in the previous analysis, there was a sharp decline noted in the Potcoin price which....
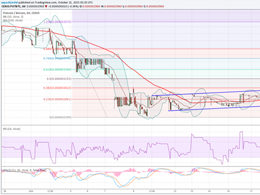
Ethereum classic price broke a short-term resistance, but this break cannot be encouraging until ETC/BTC closes back above 0.00208BTC. Key Highlights. Ethereum classic price after creating a minor new low versus Bitcoin started to recover. There was a bearish trend line formed on the hourly chart of ETC/BTC (data feed via Simplefx), which was broken during the recent recovery. However, yesterday’s highlighted resistance area at 0.00208BTC is still in place. Ethereum Classic Price Recovery. Ethereum classic price after declining versus Bitcoin, formed a minor new low. The price traded as....