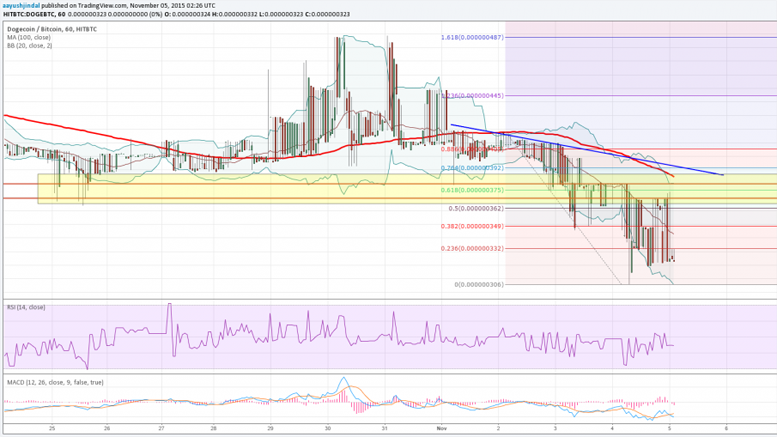
Dogecoin Price Technical Analysis - Breakdown Looks like the Real Deal
Key Highlights. It looks like there is no stopping the sellers, as the Dogecoin price continued to weaken Intraday. Yesterday's highlighted sell idea played well, as the price declined below 35.0. The hourly RSI is below the 50 level, signaling the fact that buyers are struggling to gain traction. Dogecoin price broke yesterday's low of 34.7 Satoshis to trade towards 30.0 Satohis which seems to be an important support area. What we can expect next? The Dogecoin price formed a new weekly low around 30.0 Satoshis, which represents a major support area and might ignite a corrective rally.....
Related News

Dogecoin has undergone a massive correction of roughly 10% in the past 24 hours, with the price nose-diving from 49.8 satoshis to 45.1 satoshis. As a result of this fall, Dogecoin has neared the floor of 43 satoshis, which if cracked, could lead to a severe collapse in the price. But, will it? Let us find out with the help of technical analysis below. Technical analysis implemented on the 240-minute Dogecoin/Bitcoin price chart reveals that bears are pouncing on every opportunity to jettison Dogecoin en masse. The support of 43 satoshis may well give way to a lower ground, if bulls....

In what appears to be the first conclusive sign of an upcoming breakdown, Bitcoin ended yesterday's trading session at the lowest closing for September-to-date. And currently, Bitcoin seems to be staging a fake pullback to entice more market participants to go long without reading too much into the breakdown. Bitcoin is currently trading at $227.92 and the resistance is now at $228.60. In the previous Bitcoin price technical analysis A Disappointing End to the Week!, we discussed how the technical indicators were reflecting the bearish sentiments in Bitcoin, and today, we are going to....

An absolute calm has engulfed Dogecoin as the price remains trapped in a tight range of 50.8-51.9 satoshis. The market is severely testing the patience of the short-term traders, who now fear that a surprise breakout could trigger huge losses. The market may be waiting for a trigger to break free but until that happens, it would only be wise to trade the range with minimum quantities. Dogecoin price chart, Dogecoin analysis. Nothing much has changed in the past 24 hours in terms of price (the current value of each Dogecoin is 51.1 satoshis) but the chart structure has definitely....
Dogecoin Price Key Highlights. Dogecoin price did indicate further downside momentum, as predicted in an earlier technical analysis write-up on the consolidation pattern repeating itself. With the downside break, more sellers could hop in the ongoing downtrend and push dogecoin price to new lows. Dogecoin price confirmed the buildup in bearish pressure with a strong downside break below the consolidation pattern on its 1-hour chart. Where To Next? Price has broken below the previous lows in October 21, hinting that bears are unstoppable at this point. Stochastic and RSI are both on the....

The Dogecoin price surged near 1.5% against the BTC during the March 11th trading session, thereby establish smaller bullish corrections in an already bearishly-biased market. The market however continues to face strong upside risks that, if tested, could really pulldown price back to invalidate the currency near-term bull sentiment. Following is the elaboration of this theory. As you can notice the DOGE/BTC 4H Chart above, sponsored by Trading View, the Dogecoin price has clearly formed new higher highs in order to test the 61.8% retracement - aligning with 54. Just after that, you could....