
Bitcoin Weekly Price Technical Analysis - Overbought, Time For A Correction?
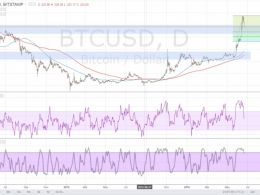
Now at $441, Bitcoin is close to registering the highest weekly closing of 2015. As the cryptocurrency remains in the strong grip of the bulls, speculators are creating even more bullish positions. But have they pushed Bitcoin into the danger zone? Is a correction in the offing? Let us try to predict that by conducting a technical analysis on the weekly BTC-USD price chart taken from the Bitstamp exchange. Image. Bitcoin Chart Structure. As can be seen from the chart above, Bitcoin is trading in a strong higher-top, higher-bottom structure. The cryptocurrency has breached the resistance....
Related News

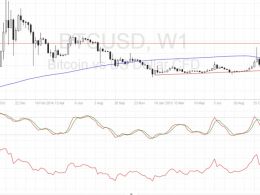
Bitcoin has failed to latch onto the weekly high of $466.64, coming down swiftly to $442.38 in a week dominated primarily by the first US interest rate hike in almost a decade. Interestingly, the cryptocurrency failed at the same level in the previous week also. As the week comes to a close on a relatively weak note, it might provide the bears with a much-needed impetus to make Bitcoin less expensive. Image. We will discuss today the weekly BTC-USD price chart from the Bitstamp exchange. The picture is very similar to what we observed in the previous weekly price technical analysis of....
Bitcoin price gave in to overbought conditions and is in the middle of a large correction to an area of interest. Bitcoin Price Key Highlights. Bitcoin appears to have hit a ceiling at the $775 mark, making a break below a short-term consolidation pattern and moving towards the nearby support. Price is now trading below the $700 mark and could head further south until $650, which is close to the 38.2% Fibonacci retracement level and a former resistance. A bounce off this correction area could allow bitcoin price to resume its climb to the recent highs and beyond. Technical Indicators....
Bitcoin price made a strong upside breakout on Friday and could be in for a larger climb after a bit of correction. Bitcoin Price Key Highlights. Bitcoin price made a strong breakout from the $500 yearly highs, indicating its potential to keep the bullish run going. Zooming out to the longer-term weekly chart shows the next possible resistance levels. However, technical indicators are hinting that buyers are feeling exhausted and that a correction might be due. Technical Indicators Signals. The 100 SMA is above the longer-term 200 SMA on the weekly chart so the path of least resistance is....

Bitcoin continues to stay inside an overbought territory that amounts to a further downside correction.
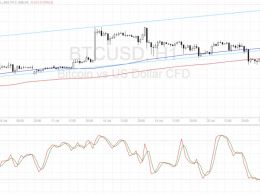
Bitcoin price looks ready for a selloff but a quick correction from the breakdown might take place first, giving bears a better entry point. Bitcoin Price Key Highlights. Bitcoin price recently broke below the ascending channel support, signaling that a reversal from the uptrend is about to take place. Price bounced off the $660 area and appears to be making a correction from here. Bitcoin could retest the broken support around the $670-675 levels before resuming its slide. Technical Indicators Signals. The 100 SMA is still above the longer-term 200 SMA for now so the path of least....