Litecoin Price Technical Analysis For 29/12/2015 - Buyers Continue To Struggle
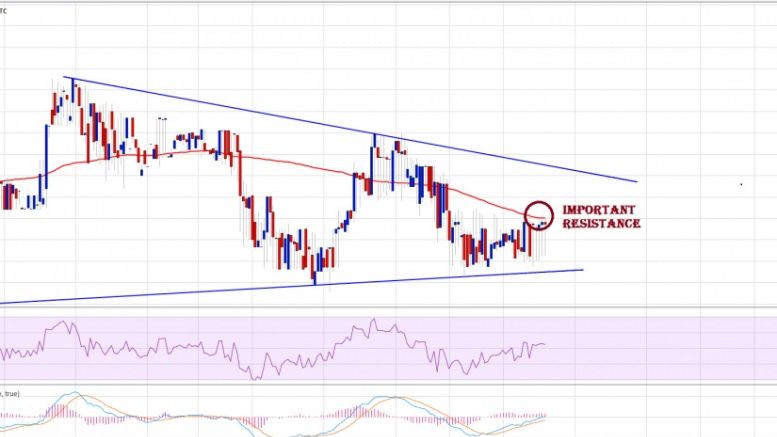
Litecoin price moved a few points higher to trade near the 100 simple moving average on the 2-hours chart (data feed from HitBTC). However, sellers defended the 100 MA successfully and prevented the upside move. There were more than two attempts to break it, but buyers failed to take the price higher. If we look at the technical indicators, then there are a few bullish signs. The 2-hours MACD is in the bullish zone, and the RSI is above the 50 level suggesting that there is a chance of an upside break.
Related News

After registering a fresh 2015-top of $3.194, Litecoin can be seen consolidating below $3.000. However, with momentum and chart structure strongly supporting the buyers, Litecoin has edged up 3.33% to $2.945. Now that the key trigger for the financial markets world, i.e. the Fed meeting has been priced in, it would be interesting to see if Litecoin is able to continue its rally. Technical analysis of the 240-minute LTC-USD price chart suggests that the cryptocurrency is still a very risky trade and should be avoided for now. Litecoin Chart Structure - As can be seen from the chart above,....

Litecoin price struggle to trade higher continues. It looks like it may head lower as the 4-hours chart is signaling a critical break. Intraday Support Level (HitBTC) may be at $$3.00. Intraday Resistance Level (HitBTC) where buyers could struggle can be at $3.15. Litecoin price struggle to trade higher continues, and it looks like it may head lower as the 4-hours chart is signaling a critical break. Litecoin price recently tested the $3.00 support area where it found buyers and corrected higher. However, it is facing a lot of hurdles on the way up. Looking at the 30-mins chart (data feed....

Litecoin falls 1.47 percent to $3.075 after kissing the resistance at $3.130. In the previous Litecoin price technical analysis, we said that Litecoin could leapfrog to higher levels on consistent support from the buyers, but what we have got instead is a bout of profit booking which once pulled down the price to an intraday low of $3.050. But can this decline prove fatal to Litecoin? Will the crucial support of $3.000 be breached? Let us try to find that out by conducting a technical analysis on the daily LTC-USD price chart. Litecoin Chart Structure - As can be seen, the higher top,....

Litecoin has dropped 6.47 percent to trade at $2.733 as the underlying negativity comes to the fore. We discussed in the previous Litecoin price technical analysis The Pressure is Evident that there is a very low probability of the price trending higher and that bears may make an early comeback. This decline has also brought the price closer to its very important technical support of the 200-day simple moving average (SMA). The question that the trading community is now asking is: will this level cushion Litecoin once again? I continue to remain bearish on Bitcoin as well, which I believe....

Litecoin price has jumped 3.35 percent to $3.980 after retesting the downward sloping support line. In the previous Litecoin price technical analysis Cautiously Optimistic, I had revised the support level to $3.720 and suggested that a weakening Bitcoin could add more pressure on the Litecoin bulls. As Bitcoin came down with a thud, Litecoin also tumbled to a low of $3.764 before gaining positive momentum. Short covering may have also helped the bulls' cause. Technically, Litecoin is still on a slippery slope but rising after retesting the support should give confidence to the buyers. Take....