Litecoin Price Technical Analysis - Next Leg Lower Underway?
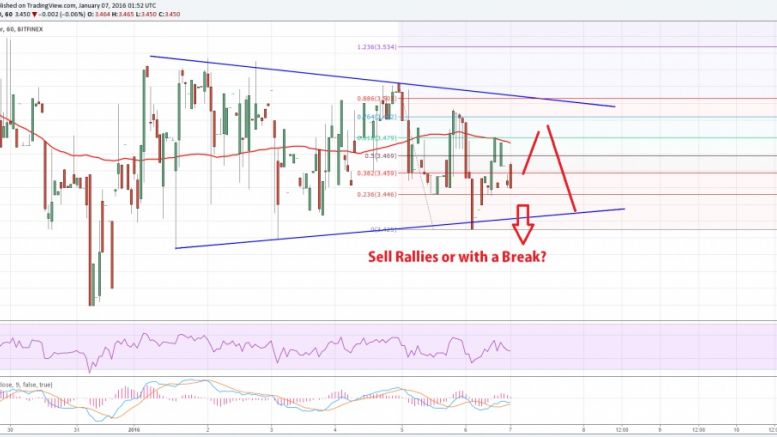
Our highlighted break for Litecoin price on the 30-min chart via the data feed from Bitfinex was true as the price continued to move down. The price even broke the $3.44 low and formed a new low of $3.42. Now, if we look at the hourly chart via the data feed from Bitfinex, then there is a contracting triangle pattern formed. However, one critical point to note is the fact that the price is now below the 100 hourly simple moving average. The price already tested the triangle support area on a couple of occasions, but buyers managed to prevent a downside break. There is a chance that sellers....
Related News

Litecoin has expectedly obliged us with a 13 percent drop during the weekend as Bitcoin crumbles under pressure. We discussed in Bounces Off Support that even while the technical indicators were positive for Litecoin, we must remain on the short side. And that has paid off well; the cryptocurrency succumbed to a low of $3.852 before recouping some losses. Now at $4.041, Litecoin is still in tight clutches of the bears. Technical analysis of the daily LTC-USD price chart reveals that Litecoin may witness jettison by the bulls as bearish pressure mounts, and that we may see a new low in the....

Litecoin price has jumped 3.35 percent to $3.980 after retesting the downward sloping support line. In the previous Litecoin price technical analysis Cautiously Optimistic, I had revised the support level to $3.720 and suggested that a weakening Bitcoin could add more pressure on the Litecoin bulls. As Bitcoin came down with a thud, Litecoin also tumbled to a low of $3.764 before gaining positive momentum. Short covering may have also helped the bulls' cause. Technically, Litecoin is still on a slippery slope but rising after retesting the support should give confidence to the buyers. Take....

Litecoin Price Key Highlights. Litecoin price previously broke below a rising trend line support, indicating that a reversal from the recent climb is underway and that further losses are likely. Price showed follow-through with its bearish move, although a retracement to the broken support zone might still be possible later on. Litecoin price is still being dragged lower by sellers, as the selloff hasn't looked back since its breakdown from the rising trend line on the 4-hour time frame. Technical signals show exhaustion. The selloff might be losing steam, as technical indicators like....

It seems that the big negatives I mentioned in my previous analysis are coming into play, and well. Since yesterday, Litecoin has crashed in excess of 12% and is now trading at $3.980. If Litecoin fails to recover these losses and closes today's session below the strong support of $4.100, we may see a huge decline of 25% in the coming sessions. And I strongly believe that we will see lower levels. Let's take a look at the technical analysis of the daily LTC-USD price chart above. Litecoin Chart Structure - Litecoin had been consolidating above the support level for a considerable time,....

The rocket has run out of fuel, and it's crashing! Yes, I am talking about Litecoin. The dream investment of many until Friday has turned into a nightmare today. And those who are still holding on to their Litecoin investments may witness more pain. The speculators with deep pockets look set to unravel more of their long positions and cause a steep decline in the price of the cryptocurrency. For those who were unable to track the market during the weekend, Litecoin crashed a biblical 58.26% from a high of $8.650 to a low of $3.610 in a matter of less than 48 hours. Litecoin pared the....