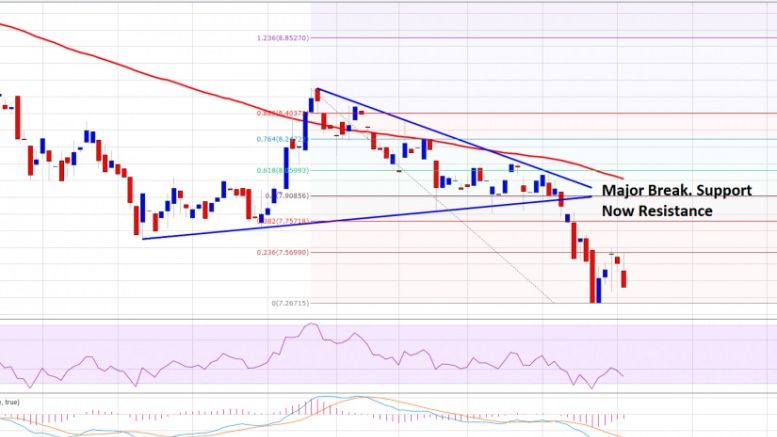
Ethereum Price Technical Analysis – Risk of Further Declines
Ethereum price dived sharply during the past two sessions. ETH/USD broke a major support, which may now act as a sell zone. Ethereum price ETH failed to move higher during the past couple of sessions against the US Dollar and traded lower. Yesterday, I highlighted contracting triangle pattern on the hourly chart (data feed via Kraken) of ETH/USD, and was looking for a break. The price instead of moving higher, moved down and broke a major support area of $8.00-$7.80. The price traded as low as $7.26, and attempted a recovery once. However, ETH found offers near the 23.6% Fib retracement....
Related News
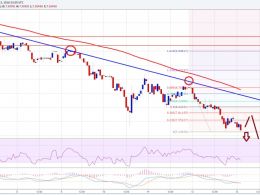
Ethereum price is still bearish, and every correction may be a chance to sell ETH/USD. Can sellers push the price towards $7.00? Ethereum price ETH failed once again as forecasted and moved down. Yesterday, I highlighted that ETH/USD may move down once again and retest the $7.36 levels. The price did move down and I hope you all booked profits. There was a new low of $7.13 created for ether price, and there are chances of more declines in the near term. There seems to be no relief for ETH buyers, as there was a continuous bearish pressure noted in the price. Yesterday’s highlighted bearish....

The Christmas isn’t turning out to be merry for Bitcoin. The cryptocurrency is struggling near the overhead resistance of $465. It is now trading 1.28% lower at $450.89, raising concerns that the market participants might pull out their funds in the holiday season. As a result, several technical indicators are also showing declines. We advised in the previous Bitcoin price technical analysis Target Achieved that traders should book at least partial profits in their long positions. And for today’s analysis, we will again be using the 4-h BTC-USD price chart from BITSTAMP.
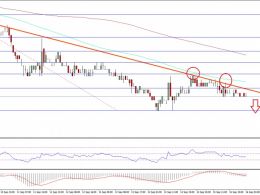
Ethereum classic price attempt to recover versus Bitcoin failed, as the price remained under a major resistance area of 0.00205BTC. Key Highlights. Ethereum classic price after a decline against Bitcoin attempted a recovery, but failed near 0.00205BTC. There is a new bearish trend line forming on the hourly chart of ETC/BTC (data feed via Simplefx), which is acting as a resistance. The price remains at a risk of more declines in the near term as long as it is below the 100 hourly simple moving average. Ethereum Classic Price Decline. Ethereum classic price managed to correct a few points....

Ethereum has plummeted more than 5% in the past 24 hours to touch a low of 0.00187BTC. Currently sustaining at 0.00192BTC, Ethereum does not provide a low-risk trading opportunity to the market participants. But yes, those who would have followed our short advice in the previous Ethereum price technical analysis A Decisive Breakdown would have profited. At the current level, I am compelled to put forth points which solidify my opinion that the ETH-XBT pair is in a “no-trade” zone. I will be drawing these points from the 4-h ETH-XBT price chart taken from KRAKEN exchange. Chart Structure –....

Ethereum Price Key Highlights. Ethereum price is gaining downside momentum as it proceeds to create new record lows below 0.00211BTC. No reversal candlesticks are in sight just yet, indicating that the selloff could carry on. Ethereum price seems to be aiming for new lows, as more sellers hopped in on the recent break from consolidation. Technical indicators are also suggesting that further losses are likely. Not yet oversold? On the daily chart of ethereum price, stochastic and RSI are still pointing down, which suggests that price can keep heading south. Shorter-term time frames don't....