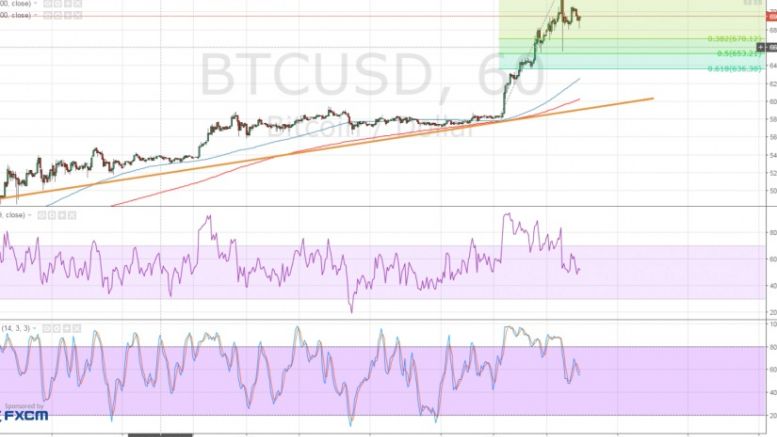
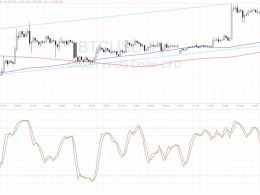
Bitcoin Price Technical Analysis for 06/14/2016 – Potential Uptrend Correction
Bitcoin price looks ready to make a correction from its recent rally, giving buyers a chance to hop in the uptrend at better levels. Bitcoin Price Key Highlights. Bitcoin price recently made a strong rally but it looks like bulls are booking profits. This could offer a nice opportunity to enter on a short-term correction from the sharp climb. Using the Fibonacci retracement tool on the latest swing low and high on the 1-hour time frame shows potential entry points. Technical Indicators Signals. The 100 SMA is above the longer-term 200 SMA so the path of least resistance is to the upside.....
Related News
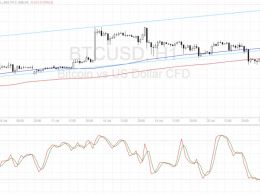
Bitcoin price looks ready for a selloff but a quick correction from the breakdown might take place first, giving bears a better entry point. Bitcoin Price Key Highlights. Bitcoin price recently broke below the ascending channel support, signaling that a reversal from the uptrend is about to take place. Price bounced off the $660 area and appears to be making a correction from here. Bitcoin could retest the broken support around the $670-675 levels before resuming its slide. Technical Indicators Signals. The 100 SMA is still above the longer-term 200 SMA for now so the path of least....
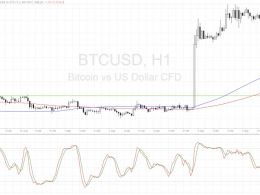
Bitcoin price might be in for a pullback opportunity to these inflection points before resuming its climb. Bitcoin Price Key Highlights. Bitcoin price recently made a strong rally and zooming in to the 1-hour chart shows potential correction levels. A bullish flag pattern can be seen on the longer-term time frames but it looks like buyers would need to wait for a pullback. Technical indicators are showing mixed signals at the moment, which suggests a possible short-term retracement on the ongoing uptrend. Technical Indicators Signals. The 100 SMA is above the longer-term 200 SMA on the....
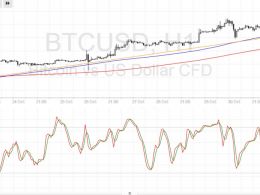
Bitcoin price is in for another dip to the ascending trend line support, offering an opportunity to buy on dips. Bitcoin Price Key Highlights. Bitcoin price made a strong rally after its bounce off the rising support, as indicated in an earlier article. The $740 area is holding as resistance, possibly spurring another potential correction to the ascending trend line support. Technical indicators are suggesting that the uptrend could continue but that profit-taking is due. Technical Indicators Signals. The 100 SMA is above the longer-term 200 SMA on this time frame so the path of least....
Bitcoin price could be due for a test of the channel support once more, with technical indicators confirming a potential bounce. Bitcoin Price Key Highlights. Bitcoin price is still inside its ascending channel pattern after getting rejected on its attempt to break past the resistance. Price could be headed for the channel support for another bounce higher. Technical indicators suggest that the uptrend could carry on. Technical Indicators Signals. The 100 SMA lines up with the channel support around $665, adding to its strength as a potential floor. In addition, the 100 SMA is safely above....
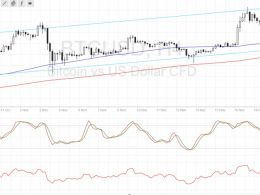
Bitcoin price is pulling back from its ongoing uptrend, offering bulls a chance to go long at cheaper levels. Bitcoin Price Key Highlights. Bitcoin price retreated upon testing its yearly highs, allowing the correction to materialize as predicted in the previous post. An ascending channel can be seen on the 4-hour bitcoin chart, and price is approaching the floor. Technical indicators are showing that the climb is likely to resume rather than reverse. Technical Indicators Signals. The 100 SMA is above the longer-term 200 SMA on the 4-hour chart, confirming that the path of least resistance....