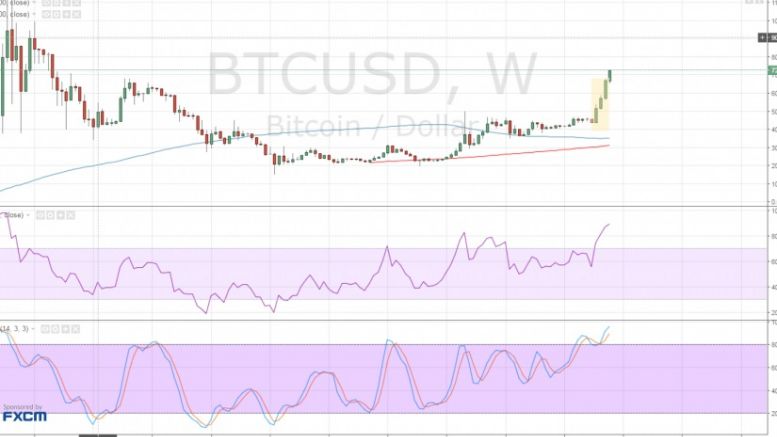
Bitcoin Price Technical Analysis for 06/16/2016 – Another Long-Term Bullish Signal
Bitcoin price has formed a three white soldiers pattern on its weekly chart, confirming that further gains are in the cards. Bitcoin Price Key Highlights. Bitcoin price could be in for a continuation of its bullish run after this chart pattern formed on its weekly time frame. A three white soldiers formation can be seen with those three bullish candlesticks after a brief period of consolidation. This signals that buyers aren’t done with their rallies, potentially taking bitcoin price to the next area of interest at $800-850 then onto $900-1,000. Technical Indicators Signals. The 100 SMA is....
Related News

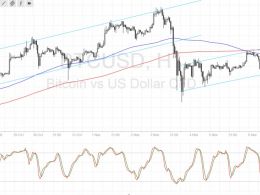
Bitcoin price has taken a pause from its recent sharp drop, as sellers are waiting for more downside pressure. Potential catalysts for bitcoin price volatility this week include the release of US retail sales, PPI, and consumer sentiment data on Friday. Most of the technical indicators on the 1-hour chart of bitcoin price seem to suggest that more losses are possible. The short-term 100 SMA has just crossed below the longer-term 200 SMA, indicating that the path of least resistance is to the downside. If a pullback occurs, the moving averages might be able to hold as dynamic resistance....
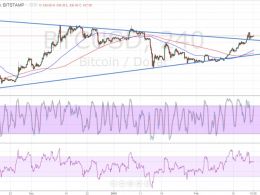
Bitcoin price made a downside break from the long-term consolidation pattern, signaling that a selloff is about to take place. Bitcoin Price Key Highlights. Bitcoin price has formed higher lows and lower highs, creating a symmetrical triangle consolidation pattern on its daily and 4-hour time frames. Price seems to have finally made a break below the triangle support, indicating that bears have taken control. If so, bitcoin could be due for a prolonged drop, possibly until the triangle bottoms at $350. Technical Indicators Signals. The 100 SMA is still above the 200 SMA on the daily time....
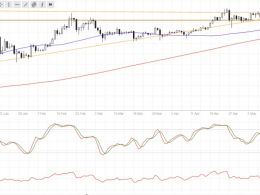
Bitcoin price seems to be forming a bullish continuation pattern following its upside break from a long-term triangle formation. Technical indicators appear to be supporting the idea of further rallies, as the 100 SMA just crossed above the longer-term 200 SMA. This suggests that the path of least resistance is to the upside, although these moving averages are still in the middle of oscillating for now so the range-bound behavior might resume. Stochastic is pointing up, confirming that buyers are in control of price action. However, the oscillator is already nearing the overbought levels....
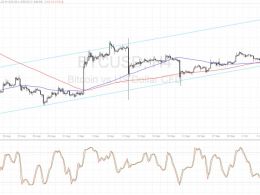
Bitcoin price staged a strong rally to break past the short-term channel top and aim for the longer-term resistance. Bitcoin Price Key Highlights. Bitcoin price enjoyed a boost in volatility yesterday, allowing it to break past the short-term channel resistance. Price is now making its way to the top of a longer-term bullish channel visible on the 4-hour time frame. Technical indicators are also suggesting that buying pressure could be in for the long run. Technical Indicators Signals. The 100 SMA is crossing above the longer-term 200 SMA to show that buyers are taking control of bitcoin....
Bitcoin price is stuck in a tighter consolidation pattern, which could set the tone for an even more explosive breakout. Bitcoin Price Technical Analysis. Bitcoin price is starting to form a new ascending channel after its previous breakdown. The consolidation is noticeably tighter these days, which suggests that price could be gearing up for a strong breakout. The US elections would likely have a strong impact on financial market sentiment and dollar price action. Technical Indicators Signals. The 100 SMA just crossed below the longer-term 200 SMA so the path of least resistance is now to....