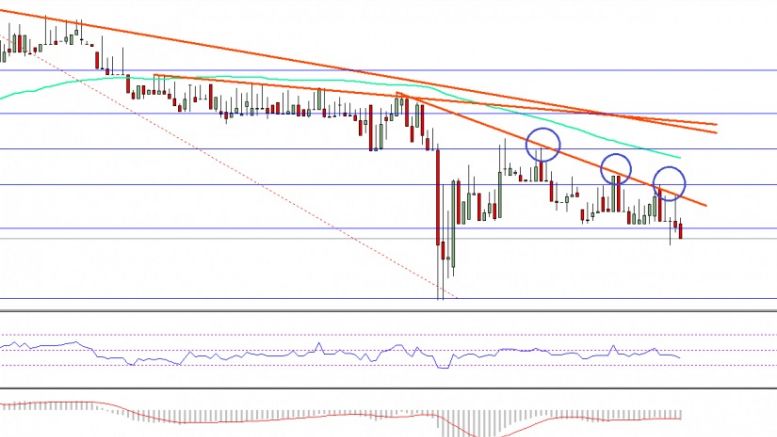
Ethereum Price Technical Analysis – Perfect Trend Line Resistance
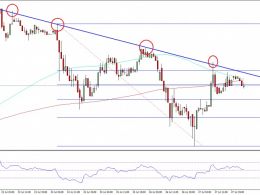
Ethereum price corrected and moved down once again versus the US Dollar. Yesterday’s trend line acted as a perfect resistance for ETH/USD. Key Highlights. ETH price after a minor rise yesterday towards 10.50 found sellers against the US Dollar, and moved down. Yesterday’s highlighted a few bearish trend lines formed on the hourly chart (data feed via SimpleFX) of ETH/USD acted as a perfect resistance. The price may continue to move lower towards $10.10 as the bearish pressure is intact. Ethereum Price Downside Move. ETH price attempt to recover the ground failed, as it moved down once....
Related News
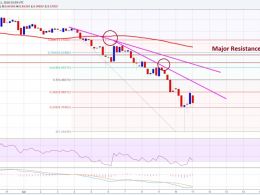
Ethereum price tumbled recently, and traded towards $8.00. It was a perfect sell, and it looks like the bulls may be exhausted. Ethereum price ETH was down and out, as there was a sharp downside move towards the $8.00 support area. I mentioned in my previous analysis that there is a chance of a decline in ETH/USD due to the technical indicators. It was a perfect sell, and the final target of $8.0 was achieved. There was a bearish trend line on the hourly chart (data feed via Kraken) of ETH/USD, which acted as a perfect catalyst for a decline. The price traded below $8.0, and a new low of....
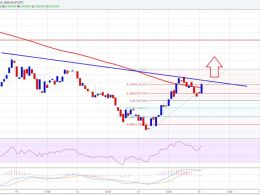
Ethereum price traded down near $7.0 where buyers appeared. Currently, it looks like there is a chance of ETH/USD breaking higher in the short term. Ethereum price ETH made a perfect bottom near $7.0. I highlighted in yesterday’s analysis that there is a chance of ETH/USD moving down towards $7.0, which can then produce a bounce. The price did test the mentioned level and moved higher later. There was a nice upside reaction, signaling more gains in the near term. ETH/USD is currently attempting to break a bearish trend line on the hourly chart (data feed via Kraken), which is also....
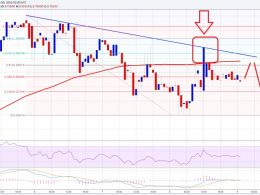
Ethereum price weakened during the past couple of sessions against the US Dollar, and looks under pressure in the near term. Key Highlights. Ethereum price dived sharply intraday against the US dollar and moved below the $12.00 area. Yesterday’s highlighted bearish trend line on the hourly chart (data feed via Kraken) of ETH/USD acted as a perfect barrier and pushed the price down. The price failed to break the highlighted resistance area, and moved down by more than $2. Ethereum Price Downside. Ethereum price ETH continued to find offers near a major resistance area as highlighted in....
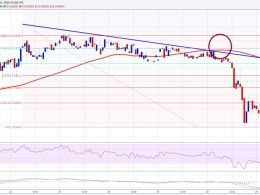
Ethereum price recovery is currently protected by a bearish trend line. Let’s see if there is a break possible in the near term or not. Key Highlights. Ethereum price started a recovery against the US dollar, but finding a crucial resistance on the way up. Yesterday’s highlighted bearish trend line on the hourly chart (data feed via Kraken) of ETH/USD is still in play and acting as a major resistance. As long as the price is below the highlighted trend line resistance, it may continue to face selling pressure. Ethereum Price Resistance. Ethereum price ETH attempted once again to trade....
Ethereum price spiked higher yesterday. However, the price found sellers around a perfect sell zone and moved down once again. Intraday Support Level can be $9.20. Intraday Resistance Level may be $10.60. Ethereum price after moving down towards $8.50 managed to gain bids and traded back higher. However, I highlighted in yesterday’s post that if the price jumps higher, then we can consider selling near a bearish trend line formed on the hourly chart (data feed via Kraken). The highlighted trend line and resistance area acted as a perfect hurdle for the bulls and pushed the price back....