Bitcoin Price Technical Analysis for 01/02/2017 – Starting the Year with a Bang!
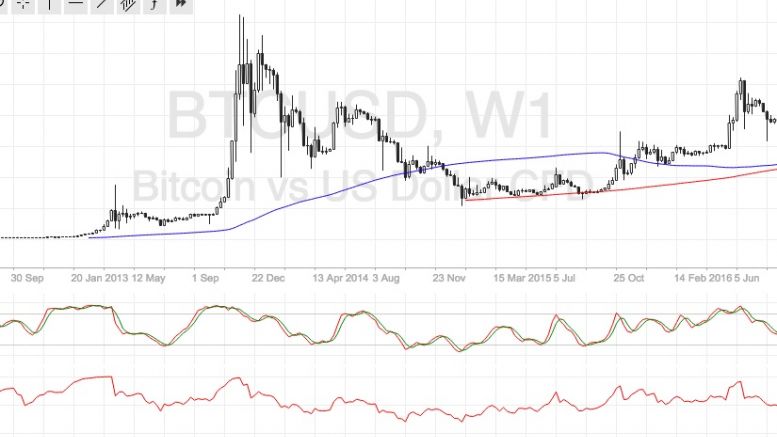
Bitcoin price seems unstoppable in its climb as it kicked off 2017 on a strong bullish note with these candlestick formations. Bitcoin Price Key Highlights. Bitcoin price was off to a good start for the year, as three long green candles are forming on the weekly time frame. This reflects strong bullish pressure onto the first trading week of January, perhaps an omen of how price action could turn out for the rest of the month. Price has taken out the long-term resistance at the $1000 mark and is setting its sights on the next ceiling at $1100. Technical Signals. The 100 SMA is still above....
Related News

Bitcoin price over the holidays touched nearly $35,000 per coin, starting off 2021 with an enormous bang. Last week’s candle was the largest in the asset’s history, dollar for dollar, with over $8,000 added from open to the top of its wick. It also resulted in such a powerful reading on the weekly Relative Strength Index, it now trumps the momentum seen in 2017 that put Bitcoin on the map in the first place. Here’s […]
Bitcoin price is starting to establish new record highs, indicating a strong start for 2017 on increased investor interest. Bitcoin Price Key Highlights. Bitcoin price followed through with its long-term bullish candlestick continuation pattern. Price has already taken out the record highs around $1200 at the very start of this year, hinting that further gains are in the cards. Bitcoin seems to be setting its sights on the $1300 major psychological level next as the bullish momentum seems unstoppable for now. Technical Indicators Signals. The 100 SMA remains above the longer-term 200 SMA....

Bitcoin rises more than 2 percent to $430.21, nearing our year-end target of $440. In the previous price technical analysis A No Trade Market, we mentioned that an increasing MFI often causes price appreciation, and we are witnessing just that. The question now is: Would bitcoin be able to extend the gains or will it retrace its steps? Let us try to predict this with the help of technical analysis conducted on the 240-minute BTC-USD price chart. Bitcoin is well poised to increase its duration inside the $400-440 range, at least for the next couple of sessions. There is a high probability....

Technical Analysis is a method for analyzing price through the study of historical data primarily focusing on price and volume specific to the market. Contrary to fundamental analysis, technical analysis is purely quantitative and does not account for a company’s intrinsic value. It utilizes previous prices and trading action to identify patterns within....

2016 may have been a dynamic year for the price of bitcoin, but 2017 is shaping up to be a dramatic one already. Bitcoin's race past $1,000 (and subsequent gyrations above and below that line) have already sparked headlines (both good and bad) worldwide, as today's dramatic fall from above $1,100 drove a massive influx of interest in the the digital currency. If you’re just tuning in to the action, you may be wondering how things got to this point in the first place. To get you up to speed, it may be helpful to look back at the past week's major price developments that took exchange....