Dash Price Weekly Analysis - Double Top in Play
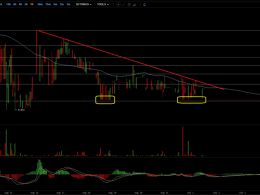
Key Highlights. Dash price surged higher before closing the week to test the previous swing high of 0.0127BTC as forecasted in one of the recent analysis. Bullish trend line formed on the hourly chart holds the key for a downside reversal in the near term. Dash price climbed higher, but it looks like there is a major hurdle at 0.0127BTC which might set the price for a move lower. Double Top Pattern at 0.0127BTC. We were anticipating the Dash price to move higher this past week. There was an upside reaction, but it was not strong enough to clear the last swing high of 0.0127BTC. The price....
Related News

Dash Price Key Highlights. Dash price made another attempt to trade above 0.0130BTC, but failed. It looks like there is a double top pattern forming, which if turns out to be true might push the price lower. The price has settled below the 100 hourly simple moving average, which is a bearish sign in the short term. Dash price failing around 0.0130BTC is a warning sign and might take it lower moving ahead. Channel Break. We were anticipating a break in the Dash price this past week, and that did happen. The price moved higher, but found resistance around 0.0130BTC which ignited a downside....

Dash Price Key Highlights. Dash price failed to move lower, and found support around a critical trend line as highlighted in yesterday's analysis. The Double top pattern is still valid, as the price is below the resistance area. If there is a break above 0.0130BTC, then more gains are possible in the near term. Dash price acquiring bids around the bullish trend line is a positive sign for buyers looking ahead. Trend Line Proved Worth. Yesterday, we highlighted that there is a possibility of a double top pattern forming on the hourly chart which could result in a move lower. There was a....

Key Highlights. Dash price after surging higher corrected lower as forecasted in the weekly analysis. There is a major support building around 0.0125BTC, which is likely to act as a pivot area. A bullish trend line is also formed, which is a crucial barrier for sellers. Dash price correction phase is likely to complete soon, which means buyers might take control in the near term. 0.0125BTC as a support. As highlighted in the weekly analysis, the Dash price surged higher after clearing a couple of major resistances like 0.0120BTC and 0.0125BTC. The upside after the break was stalled around....

The price of LoopRing (LRC) has shown no sign of relief bounce against Tether as it continues to range in its low region. Despite relief bounces shown by other cryptocurrencies across the market, some producing double-digit gains, LoopRing price continued to look dormant. (Data from Binance) Related Reading: ANKR Gained 12% In The Last 24 Hours. What’s Pushing It? LoopRing Price Analysis On The Weekly Chart From the chart, the price of LRC saw its weekly bottom at $0.35; the price of LRC bounced from that region to a price of $0.4 on the weekly chart as the price is unable to show much....
Key Highlights. Dash price continued to surprise sellers as there was a major support area formed around 0.0110BTC. A bearish trend line is formed, which buyers need to clear if they have to take the price higher. A possible double bottom pattern is formed around 0.0110BTC, which might encourage buyers. Dash price found support near 0.0110BTC, but buyers need to gain pace if they have to take the price higher. What's next? There was no real action this past week in the Dash price, but there was a positive sign for bulls as a major support area was formed around0.0110BTC. Sellers made....