
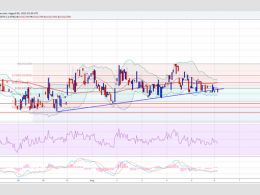
Dash Price Technical Analysis - Double Top?
Dash Price Key Highlights. Dash price made another attempt to trade above 0.0130BTC, but failed. It looks like there is a double top pattern forming, which if turns out to be true might push the price lower. The price has settled below the 100 hourly simple moving average, which is a bearish sign in the short term. Dash price failing around 0.0130BTC is a warning sign and might take it lower moving ahead. Channel Break. We were anticipating a break in the Dash price this past week, and that did happen. The price moved higher, but found resistance around 0.0130BTC which ignited a downside....
Related News

Dash Price Key Highlights. Dash price failed to move lower, and found support around a critical trend line as highlighted in yesterday's analysis. The Double top pattern is still valid, as the price is below the resistance area. If there is a break above 0.0130BTC, then more gains are possible in the near term. Dash price acquiring bids around the bullish trend line is a positive sign for buyers looking ahead. Trend Line Proved Worth. Yesterday, we highlighted that there is a possibility of a double top pattern forming on the hourly chart which could result in a move lower. There was a....

Key Highlights. Dash price surged higher before closing the week to test the previous swing high of 0.0127BTC as forecasted in one of the recent analysis. Bullish trend line formed on the hourly chart holds the key for a downside reversal in the near term. Dash price climbed higher, but it looks like there is a major hurdle at 0.0127BTC which might set the price for a move lower. Double Top Pattern at 0.0127BTC. We were anticipating the Dash price to move higher this past week. There was an upside reaction, but it was not strong enough to clear the last swing high of 0.0127BTC. The price....

Bears hold complete control over Dash as the cryptocurrency continues with its spree of hitting fresh lows. In my earlier analysis on Dash, I had mentioned that the cryptocurrency is steadily losing and that it is best to stay on the short side of the trade; those who had followed this advice would have made good money (or avoided huge losses) as the cryptocurrency has plummeted to a 1-month low of 0.01231BTC. Dash is still under extreme selling pressure, languishing near the lows at 0.01254BTC. Although it is incredibly difficult to comment now as to when the ignored cryptocurrency will....

On the back of strong bullish pressure, Dash continued with its upward march before peaking out at 0.01610BTC. Dash then fell roughly 10% from the high to touch a low of 0.0145BTC. I had advised in my earlier analysis that the cryptocurrency was highly overbought and that it may be time to take some money off the table. Since the cryptocurrency is currently trading close to its strong resistance level, booking partial profits is the wise thing to do. Each Dash is now worth 0.01505BTC. A technical check of the 360-minute DRK/BTC price chart indicates that the virtual currency may witness....
Dash Price Key Highlights. Dash price looks like completed a 5-waves up pattern and might head lower in the near term. There is a Triple top pattern formed (as highlighted yesterday), which could push the price lower. Besides, there is a bullish trend line formed, which must be cleared for more losses in the near term. Dash price might have created a short-term top, as there is a wave sequence completed on the hourly chart. 5-Waves Pattern. As mentioned in yesterday's post, we are waiting for a break in the Dash price. There are a couple of important things formed on the hourly chart,....