
Bitcoin Price Technical Analysis for 29/9/2015 - Sluggish on the Upside
The latest price action in Bitcoin is sluggish at best. The cryptocurrency is hovering near $240 as it struggles to maintain its positive momentum on its way up. As can be remembered from the previous Bitcoin price technical analysis Know This Range, the target is $245, which also happens to be a strong resistance point. Currently, the cryptocurrency is trading at $238.50. With the price rise, the technical indicators have turned in favor of the buyers, however, I am not convinced by the latest data. Fibonacci Retracements - During trading, Bitcoin has recently hit an intraday high of....
Related News
The choppiness in the Bitcoin market is testing the patience and the wit of the trading community. While many traders are still hopeful of Bitcoin reaching $245, fears are beginning to gain ground that this choppiness is unhealthy and may derail the ongoing bullish attempt. Yesterday, as Bitcoin struggled to safeguard the accumulated gains, the price dropped to $235 in quick time. Even now, Bitcoin is trading lower at $237.60. In yesterday's price analysis Sluggish on the Upside, we discussed how the technical indications had improved substantially for the cryptocurrency, and today, we....

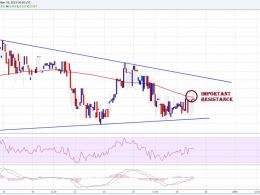
Earlier today we published a technical analysis piece detailing the upward sloping channel through which the bitcoin price was travelling. We highlighted the fact that - from resistance around 248 - we may see a temporary correction, and that this correction would likely halt at the support offered up by the aforementioned channel. Today's action has validated this analysis, and - with the correction over - we've now returned to the upside bias on the intraday level. So what are the levels to keep an eye on to the upside as we head into the US afternoon session and beyond? Take another....
Litecoin price moved a few points higher to trade near the 100 simple moving average on the 2-hours chart (data feed from HitBTC). However, sellers defended the 100 MA successfully and prevented the upside move. There were more than two attempts to break it, but buyers failed to take the price higher. If we look at the technical indicators, then there are a few bullish signs. The 2-hours MACD is in the bullish zone, and the RSI is above the 50 level suggesting that there is a chance of an upside break.

Bitcoin price is, at the time of writing, breaking out of a consolidation above $600. The market has noticed and the chatrooms are speculating if this is a time to buy. Technical analysis confirms the corrective rally proposed in yesterday’s analysis. Bitcoin price had been sticking to the Fib line near $633 (Bitstamp) and the 4hr 200MA (not shown) has risen up into the area of price action to provide additional support. After a period of consolidation, MACD Bollinger Band compression confirms the onset of price volatility. This is the typical configuration prior to a breakout, and....

In my previous analysis titled Awaiting the Showdown!, I had expressed that a big move would rock the market during the weekend and there is a high probability that it may be on the upside. As we can see, Bitcoin has jumped a huge 14% to cross the $300 barrier and is comfortably trading at $307.87. Intraday, the cryptocurrency hit a fresh 7-month high of $317.99 but stopped short of registering a new high for 2015. However, today's Bitcoin price analysis would focus on whether to stay long or book some profits in the positions. Technical analysis of the Daily BTC-USD price chart indicates....