
XRP Faces Make-Or-Break Moment Amid Bearish Threat
XRP is hovering around $2.52 on the daily chart, maintaining a delicate balance between bullish momentum and the potential for a major reversal pattern. Renowned crypto analyst Josh Olszewicz (known on X as @CarpeNoctom) shared a detailed Ichimoku-based chart, highlighting a possible Head and Shoulders formation. According to Olszewicz, a sustained break above $2.85 would likely invalidate bearish concerns tied to this classic reversal setup. Can XRP Bust Through $2.85? XRP’s most recent rally took shape in mid-October 2024, when it traded near $0.48 before rising sharply toward $3.3999 in....
Related News

Bitcoin’s quantum problem is still years away, but Bernstein says 1.7 million BTC sitting in early address types could be among the most exposed if the technology ever gets there. Related Reading: XRP Faces No Immediate Quantum Threat As Only 0.03% Supply Seen At Risk: Analyst That includes an estimated 1.1 million BTC tied to Satoshi Nakamoto, which would matter only if quantum machines become strong enough to break today’s encryption. Legacy Wallets In Focus Bernstein’s view is not that Bitcoin faces a near-term collapse. The firm’s analysts describe the issue as a “manageable upgrade....
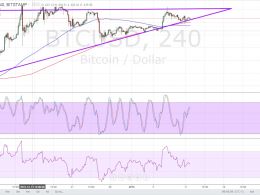
Bitcoin price is sitting at the bottom of the long-term ascending triangle, still deciding whether to make a bounce or a break. RSI and moving averages are hinting at a break while stochastic is suggesting a bounce. To figure out where bitcoin price could be headed next, let’s turn to the technical indicators. The moving averages are showing a downward crossover at the moment, with the shorter-term 100 SMA below the longer-term 200 SMA. This indicates that the path of least resistance might be to the downside, favoring further losses. If a break below the triangle support is seen, bitcoin....

This week is when volatility returns and a make-or-break moment for BTC/USD hits, traders believe. Bitcoin (BTC) is nearing the end of a consolidation period, which traders are betting will spark a fresh bullish breakout.In a tweet on Tuesday, popular trader Crypto Ed became the latest voice in the expanding bullish movement calling time on lower BTC price levels.Data: D-Day for Bitcoin price starts WednesdayAfter consolidating in a broad range since hitting $30,000, BTC/USD is printing higher lows and lower highs on lower timeframes. This narrowing wedge on the chart has a logical....
As Bitcoin (BTC) retests a critical support level, analysts have warned that the leading cryptocurrency is facing its most important week in months, which could make or break its recovery rally. Related Reading: Bitcoin Set For $88,000? Analysts Forecast May Breakout After Key Weekly Close Bitcoin Price At A Crossroads On Tuesday, Bitcoin dropped below the $76,000 support for the first time in a week, falling to the $75,666 level before bouncing. The flagship crypto has been trading between $74,000-$80,000 after breaking out of its three-month range earlier this month. Amid its recent....

Bitcoin has faced some intense selling pressure over the past few days, with the response to its recent break below $19,000 being quite bearish This validates the notion that this is a crucial level that the crypto much firmly surmount and flip into support if it is to see any further upside One trader is now noting that, while BTC did rebound off of its key support in the upper-$17,000 region, it still faces multiple […]