
XRP Price Risks Fresh Drop, Is Another Leg Lower Imminent?
XRP price started a fresh decline from $1.4380. The price is now struggling and is at risk of another decline below the $1.380 zone. XRP price started a fresh decline below the $1.420 zone. The price is now trading below $1.420 and the 100-hourly Simple Moving Average. There was a break below a bullish trend line with support at $1.4050 on the hourly chart of the XRP/USD pair (data source from Kraken). The pair could continue to move down if it settles below $1.380. XRP Price Dips Again XRP price attempted a recovery wave above $1.4220 but failed to continue higher, like Bitcoin and....
Related News
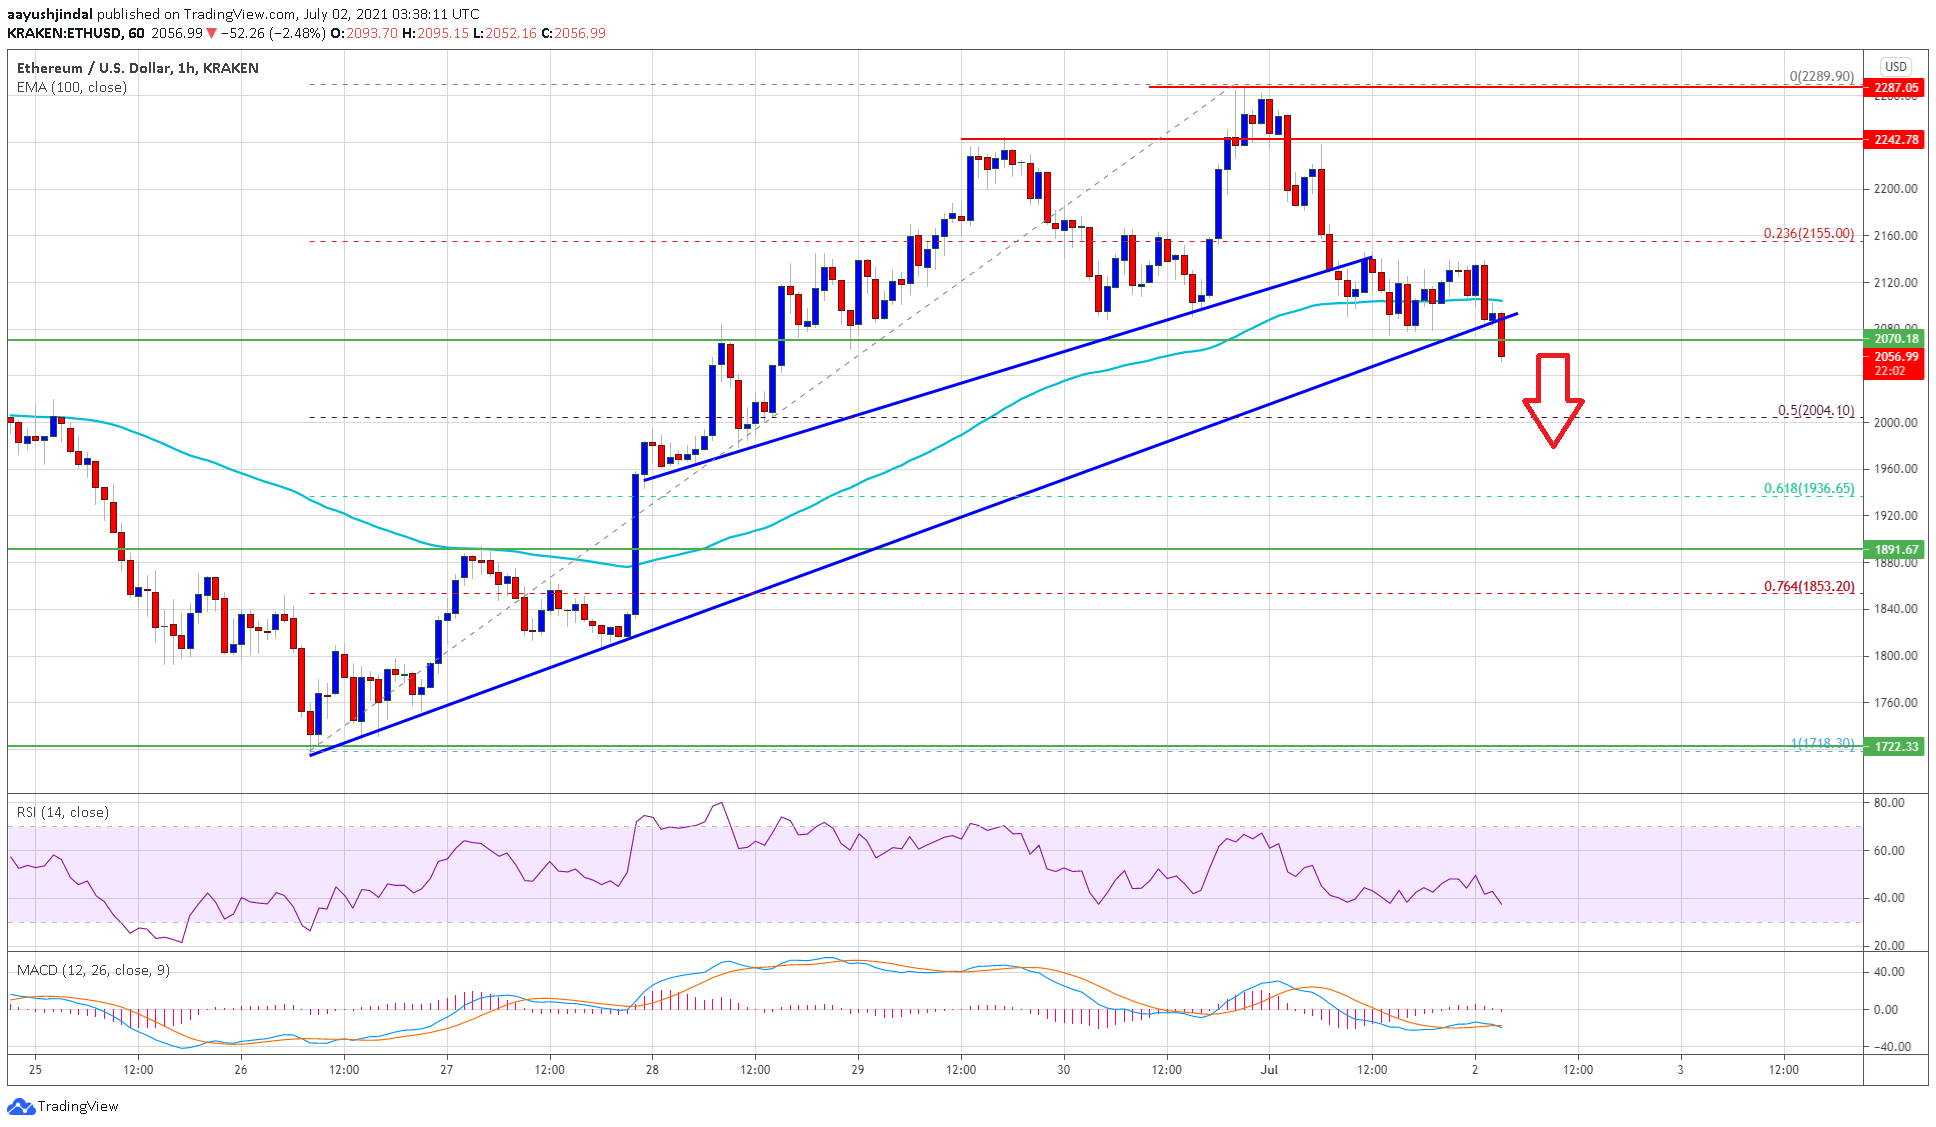
Ethereum failed to stay above $2,100 and it is now moving lower against the US Dollar. ETH price is likely to continue lower and it could even break $2,000. Ethereum started a fresh decline from well above the $2,200 support zone. The price is now trading below $2,100 and the 100 hourly simple moving average. […]
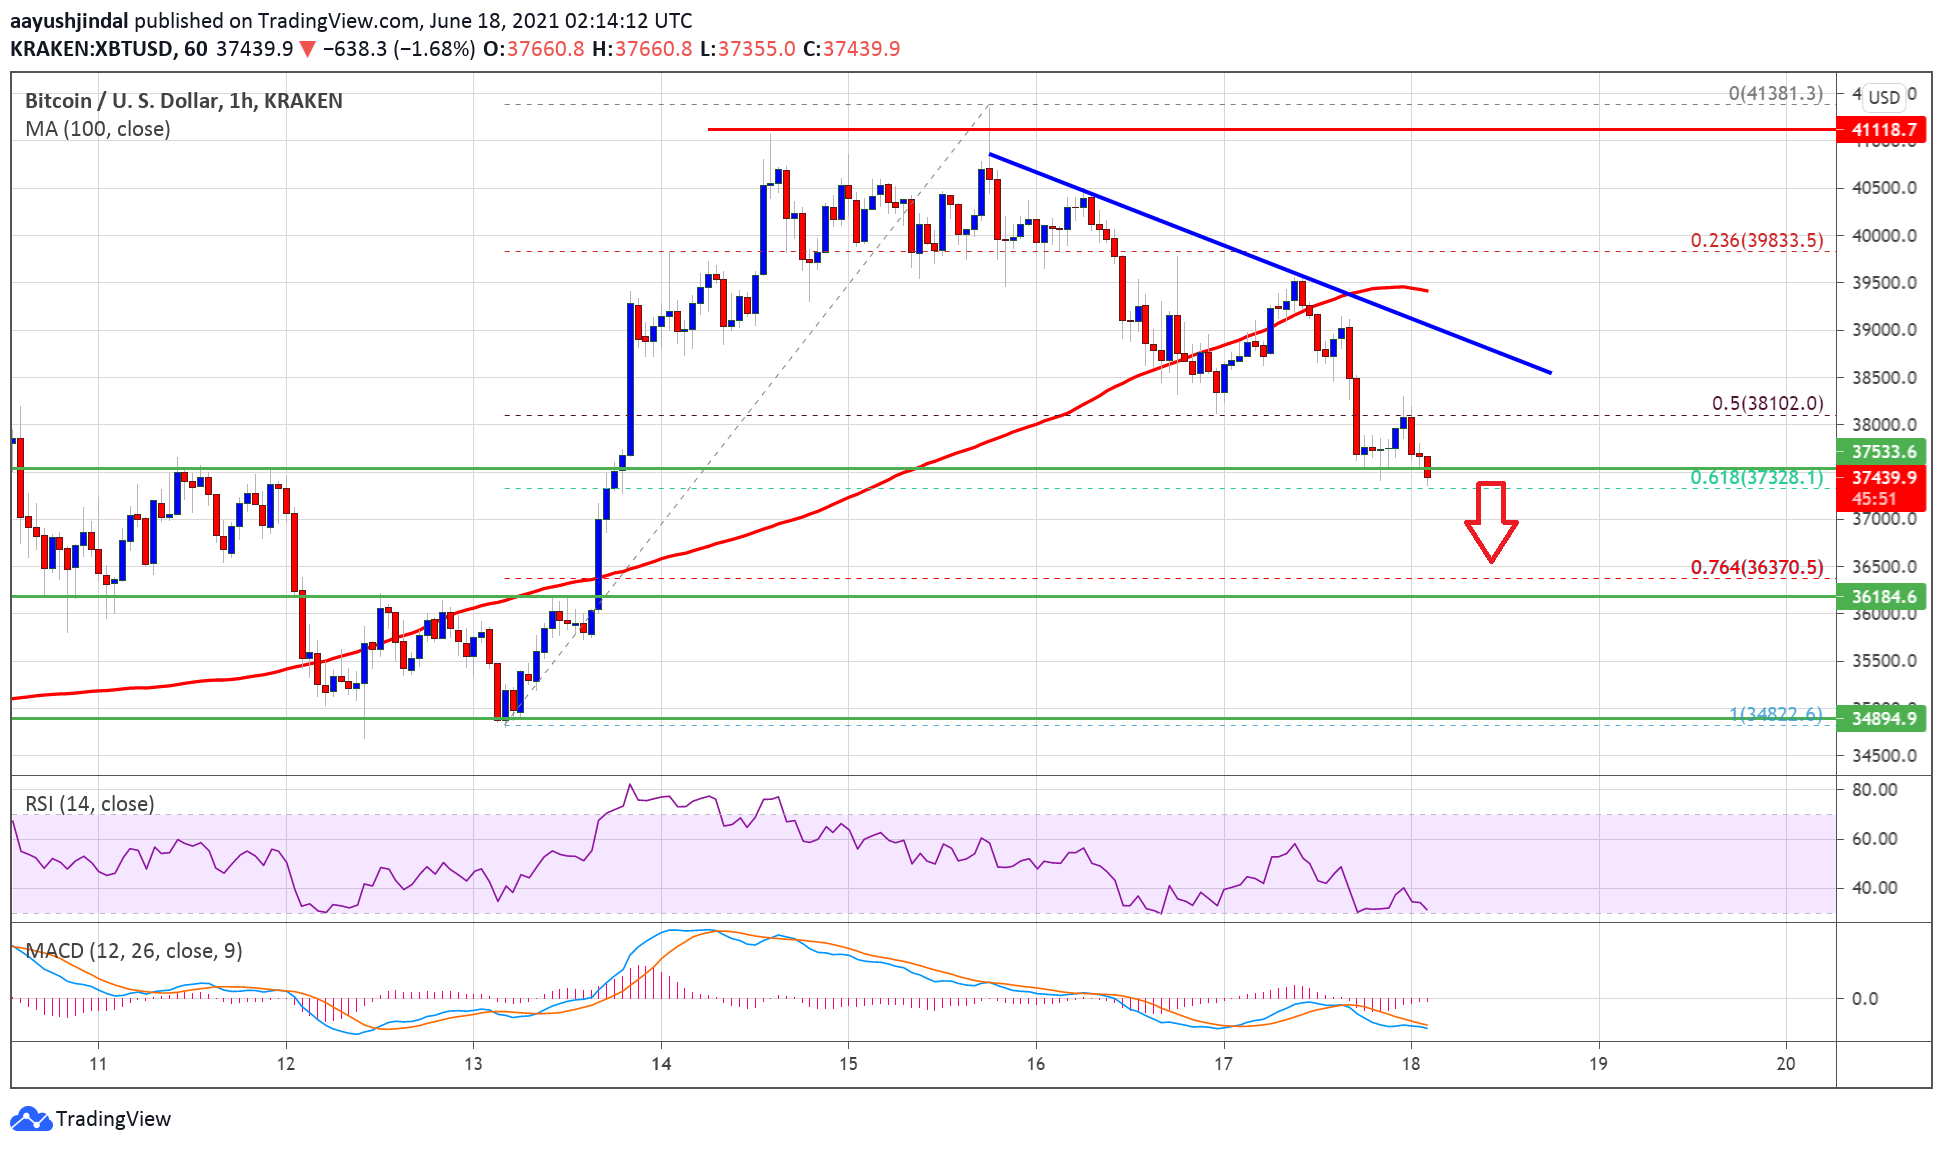
Bitcoin price started a fresh decline after it failed to stay above $40,000 against the US Dollar. BTC is moving lower and it could even decline towards $35,000 in the near term. Bitcoin started a fresh decline from well above the $40,000 pivot level. The price is now trading well below $39,000 and the 100 […]

Bitcoin price slammed down to support early today before embarking on a persistent rise that is now correcting. A directional move is imminent and today’s Fed rates announcement may be the watershed. Finally, we’re seeing compression in both the 15min and 1hr charts. The 1-day chart (not shown) is currently trading below its 20MA, but remains high above the critical 200MA. The combination of bearish bias in the 4hr and 1day charts, and the compression seen in the 1hr and 15min charts implies a move is imminent. One concern is that the structure of the past week’s price pattern is unusual.....

Cardano’s price started a fresh decline below $0.264. ADA is struggling and might accelerate lower if there is a close below the $0.250 support. ADA price is gaining bearish momentum below the $0.265 level against the US dollar. The price is trading above $0.250 and the 100 simple moving average (4 hours). There was a break below a key bullish trend line with support near $0.258 on the 4-hour chart of the ADA/USD pair (data source from Kraken). The pair must stay above the $0.250 support to start a fresh increase in the near term. Cardano Price Trims Gains In the past few days, Cardano’s....

Inflation risks grapple the newly-launched ApeCoin as it paints a classic bearish reversal pattern. A euphoric price rally by ApeCoin (APE) seen in mid-March appears to be exhausted already thanks to the coin's 70% drop in valuation in the past two weeks — and it may fall further in April.At the core of this bearish outlook is a rising wedge, a technical pattern that forms as the price consolidates upward inside a range defined by two converging ascending trendlines. In a perfect scenario, rising wedges resolve into a bearish breakout, confirmed by a decisive drop below the lower trendline....