
Bitcoin Analysis: Week of Nov 9 (Intro to Fibonacci)
In last week’s post we concluded with the following statement: As you can see last Sunday we were very Bearish at a time when price had rebounded from around US$320 to US$330. In hindsight, the bounce had a little more legs in it than initially expected, but as the primary view explains, the overall picture will remain Bearish according to the charts as long as we stay below US$400 and most like US$420. We have now turned Bearish across all time frames. Until proven otherwise any bounce is expected to just be new lower high until we can get back above US$420. What we thought was a nice....
Related News

In last week’s post we concluded with the following statement: Now that the price has reached our support target of US$500-530 zone where do we stand now? Lets take a look at the weekly chart. “The odds, however, favor more downside back to the base of the triangle at US$560 and breaking below that should take us down into the US$500-530 zone where the Fibonacci’s will have a chance to create a healthy reversal.” The comment on the 61.8% Fibonacci retracement has been changed to indicate we have reached this critical support point. An additional trend line has been added that uses the....

In last weeks post we concluded with the following statement: Friday Aug 1st started out as an impressive day yet sold off near the end. As a trader of the Fiat Financial Markets it would have been reasonable to pull the trigger and try and take advantage of the upward momentum, but keep in mind, the medium term trend is still down and the trader should have realized within a few days that the breakout back to US$625 is not imminent. Let us now take a look at the long-term view and see where we stand. Friday’s close will help guide us whether we can once again approach the 50% Fibonacci....

Bitcoin has hit the ground with a thud as bulls ran out of fuel in the middle of this week. The decline of the past 3 sessions has undone all the hard work done by the buyers after the price hit a low of $261. Bitcoin is now trading at $262.22, down 1.84 percent. It has hit an intraday low of $262. And I am sensing more pain if $260 is breached. Take a look at the technical picture of the daily BTC-USD price chart below. Bitcoin Chart Structure - Bitcoin has witnessed an incessant selling pressure after it hit its recent high of $271.50. If the cryptocurrency holds its base of $260, then a....

Egrag Crypto, a well-known crypto analyst on the social media platform X, recently shared an optimistic price prediction for XRP. According to the analyst, technical analysis of the XRP price on the weekly timeframe suggests that XRP is on track to reach a price target of $15 by May 5, 2025. Related Reading: CME Gap Threatens Bitcoin With Potential Drop To $77,000 – Analyst The analysis, which is rooted in Fibonacci levels and Elliott Wave theory, offers a long-term bullish outlook for the altcoin despite its recent decline over the past week. This is because the XRP price has been on a....
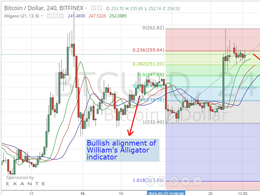
The past week was full of action on the (BTC/USD) charts. Although the week started by a bearish wave that took bitcoin price down to around $231, a rather strong bullish wave took the price up to $263 yesterday. So, let's take a look at the week's charts to better understand the current market trend. Let's take a look the 4 hour Bitfinex (BTC/USD) charts from tradingview.com, plot the William's Alligator indicator and draw Fibonacci retracements across a trend line that extends from the low recorded on the 22nd of February ($232) and the high recorded yesterday ($263) (look at at the....