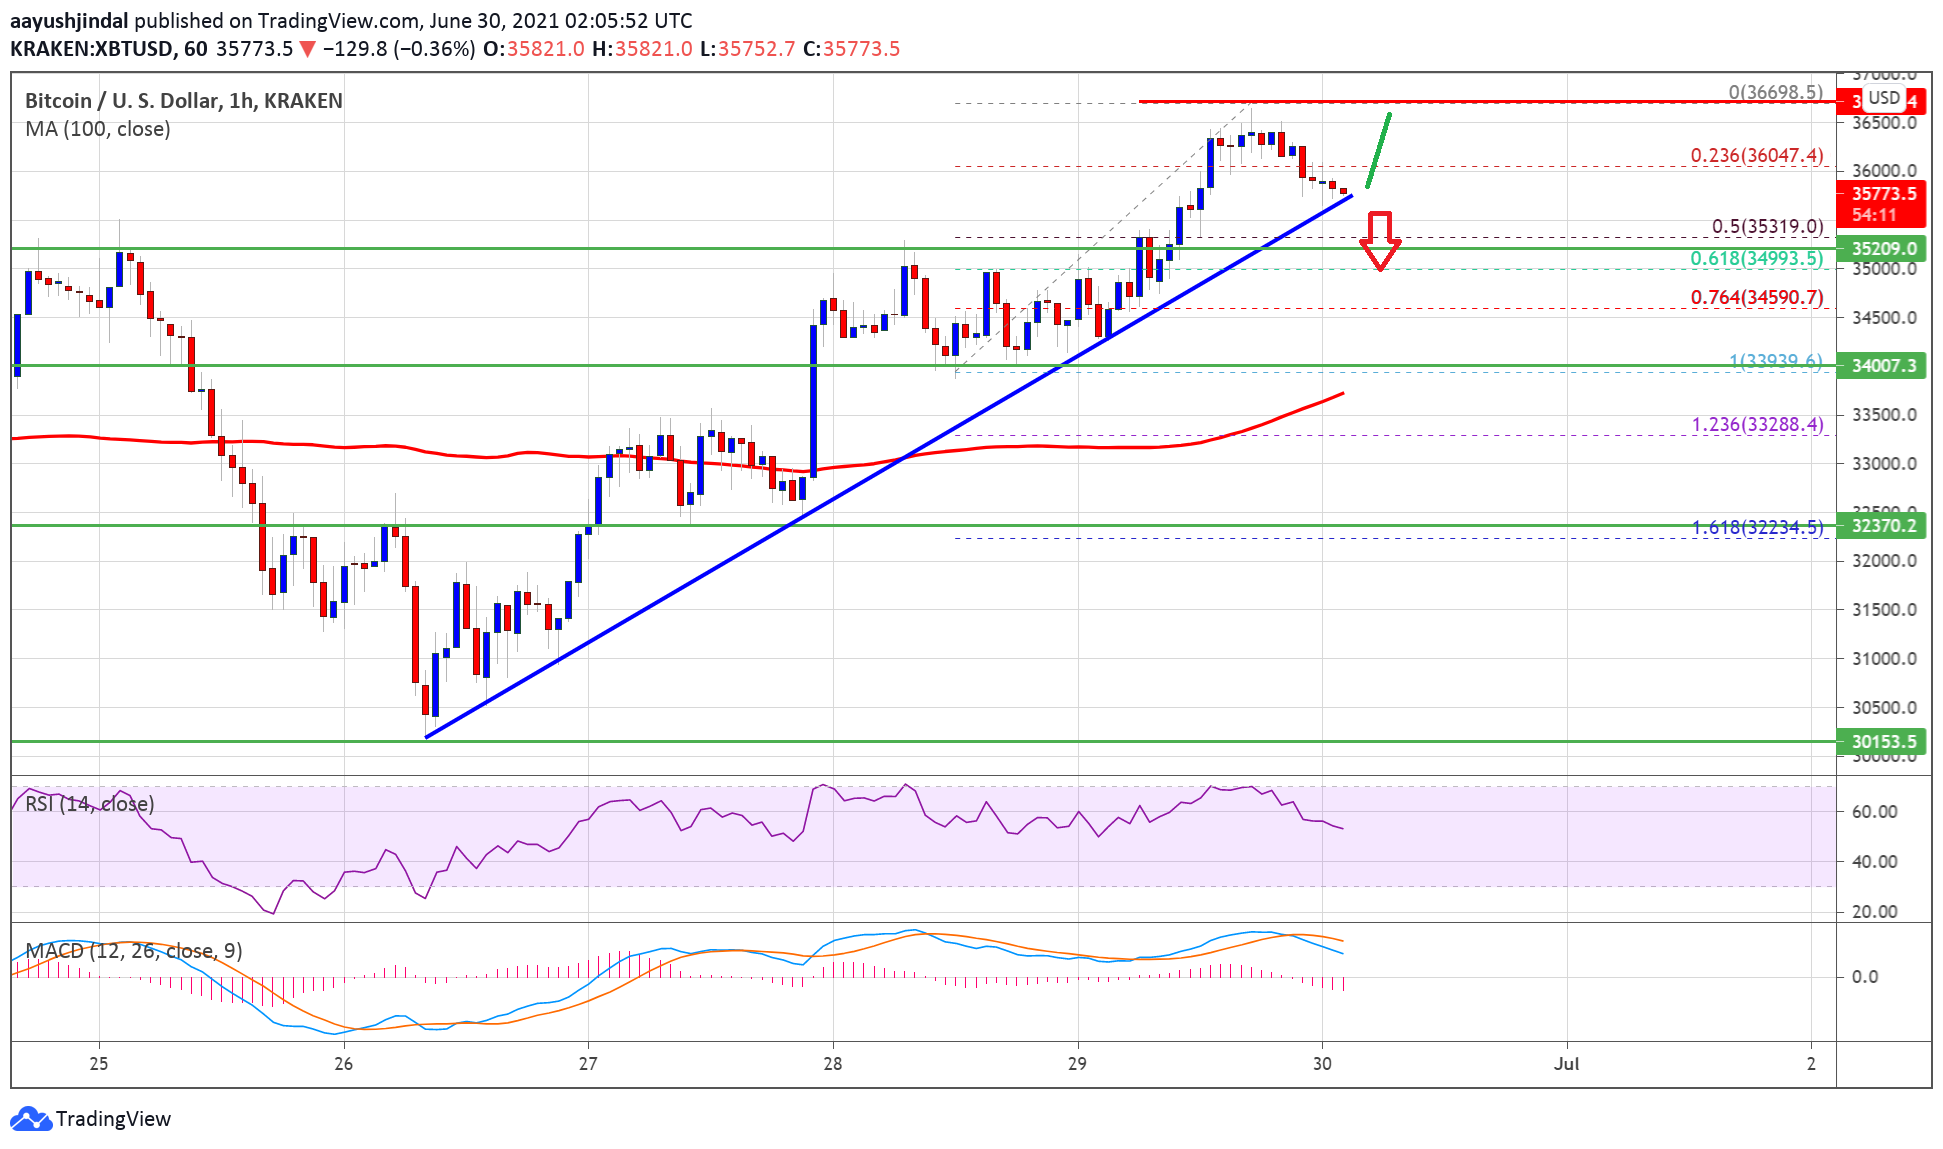
TA: Bitcoin Lacks Momentum Above $36K, Why BTC Could Correct Lower
Bitcoin price extended its recovery above the $36,000 zone against the US Dollar. BTC topped near $36,700 and it is now correcting gains. Bitcoin started a fresh increase above the $35,000 and $36,000 resistance levels. The price is now trading nicely above $35,000 and the 100 hourly simple moving average. There is a major bullish […]
Related News
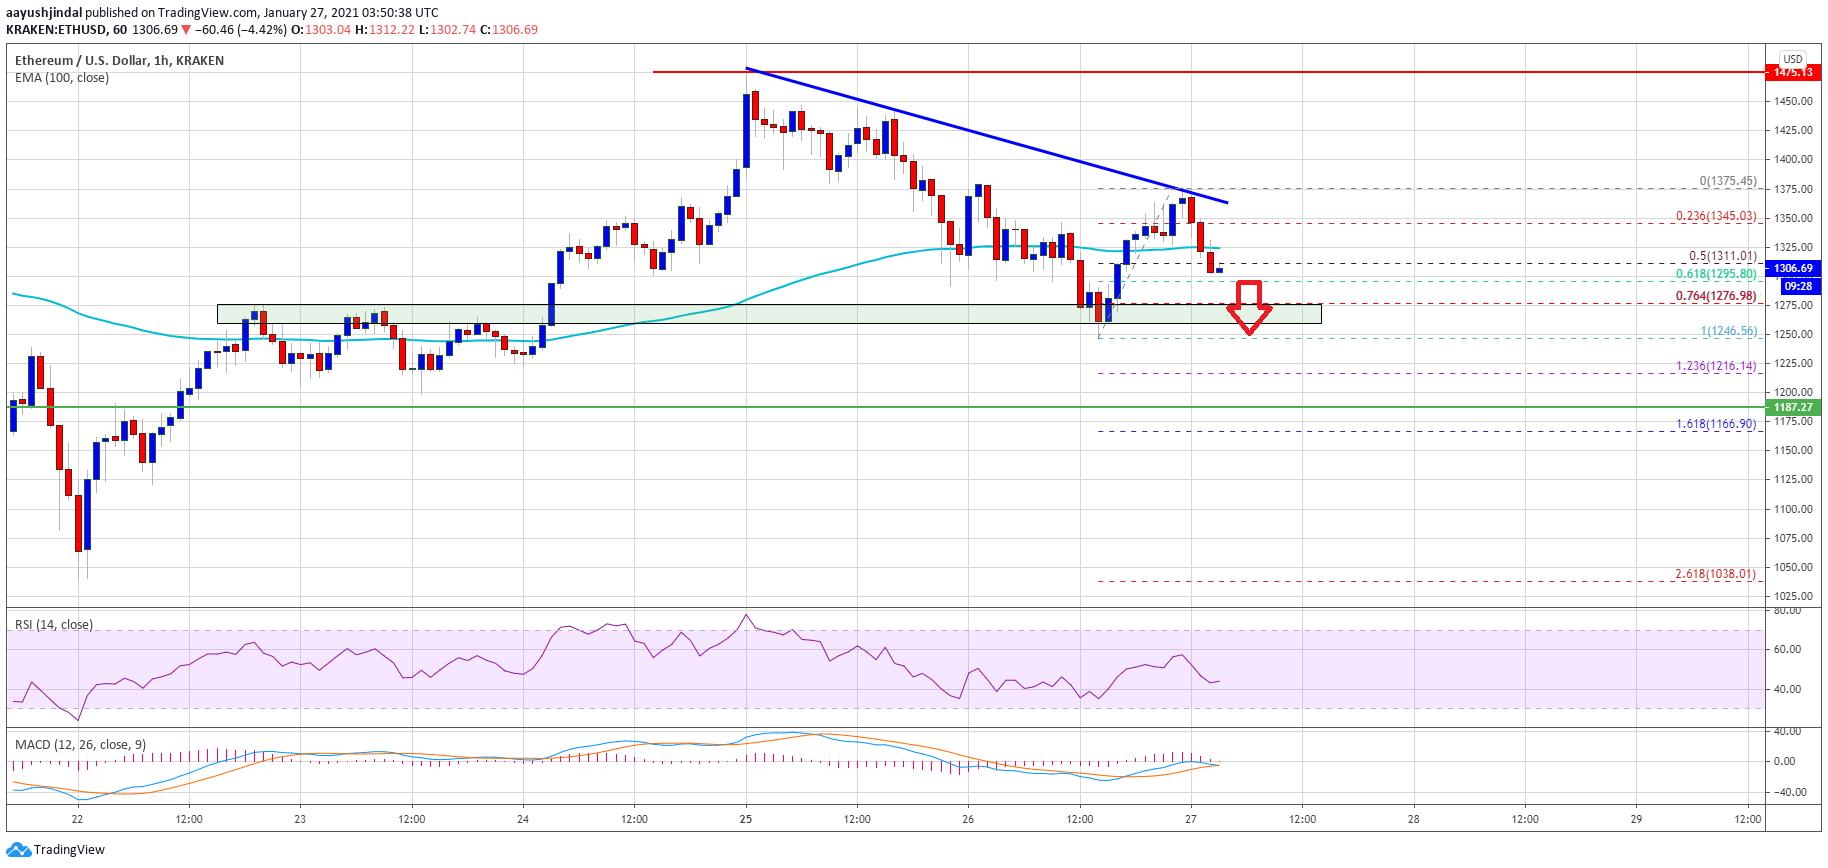
Ethereum is facing resistance near the $1,350 level against the US Dollar. ETH price could continue to move lower towards $1,200 or $1,180 unless it settles above $1,350. Ethereum is struggling to gain momentum above $1,350 and $1,375. The price is now trading well below $1,350 and the 100 hourly simple moving average. There is […]
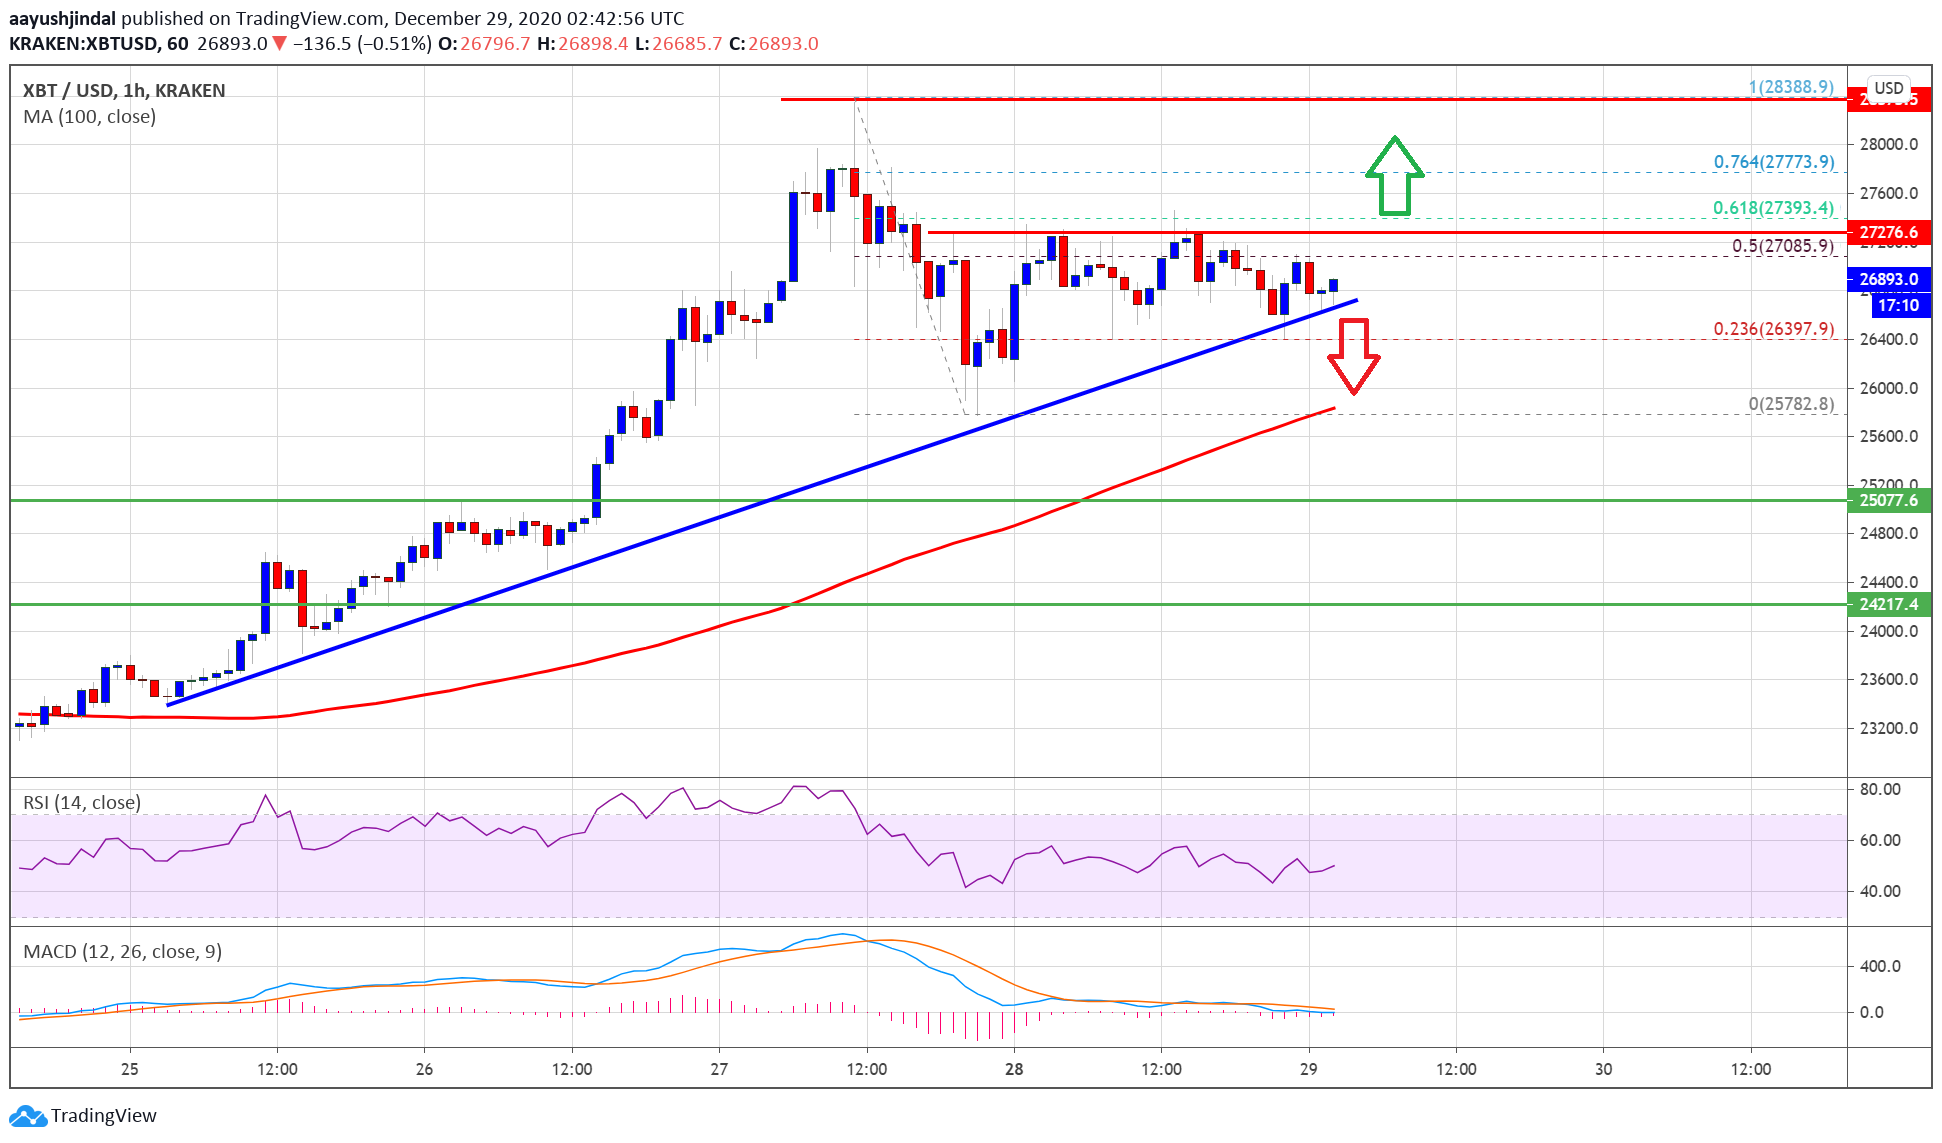
Bitcoin price is facing a strong resistance near the $27,300 area against the US Dollar. BTC could correct lower towards $26,000 or $25,500 in the near term. Bitcoin seems to be struggling to gain bullish momentum above the $27,300 barrier. The price is currently trading above the $26,500 support and the 100 hourly simple moving […]
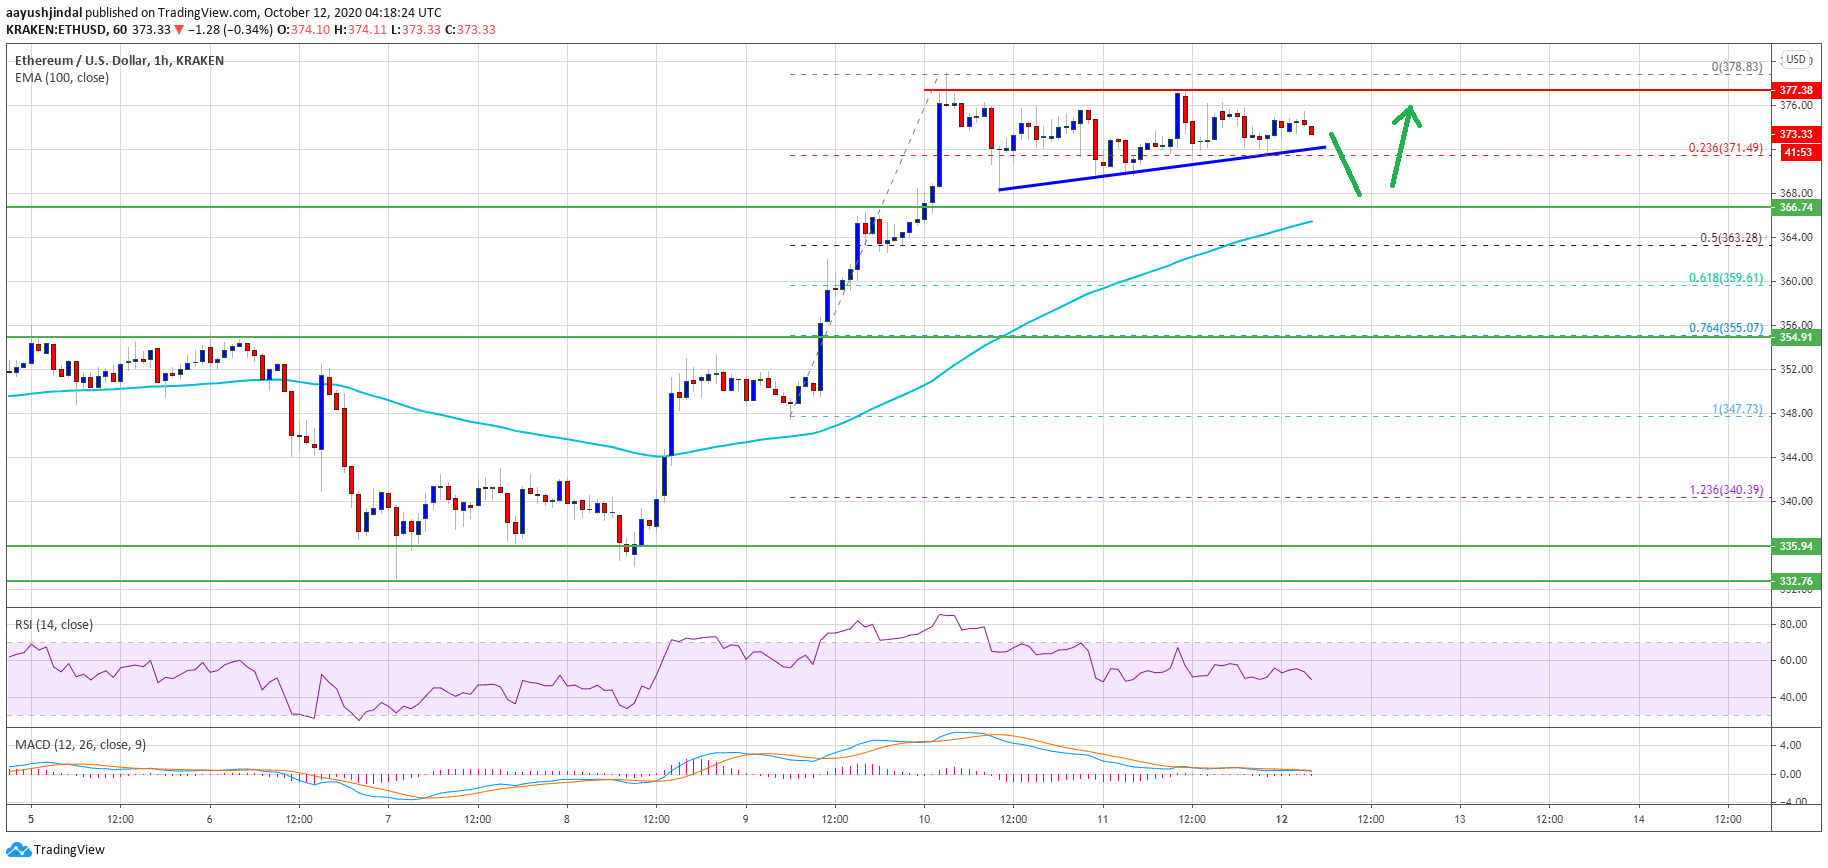
Ethereum staged a strong increase and climbed above the $370 resistance against the US Dollar. ETH price is currently consolidating gains and it could correct lower. Ethereum started a decent increase above the $355, $365 and $370 resistance levels. The price is now well above $365 and the 100 hourly simple moving average. There is […]
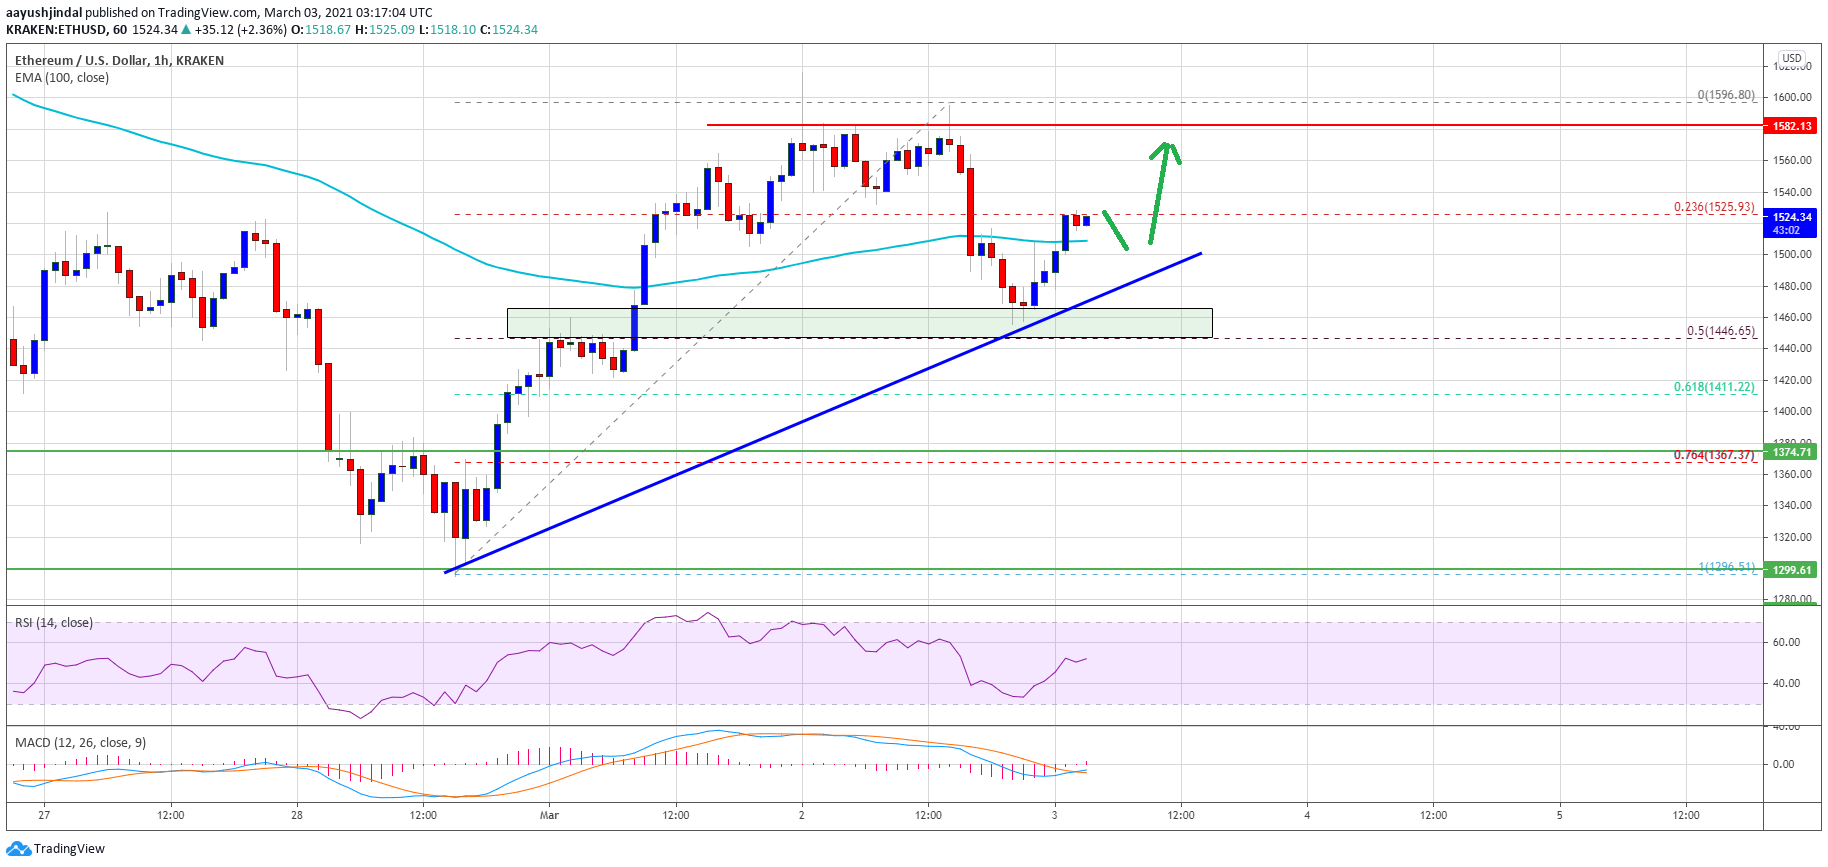
Ethereum struggled to clear the $1,600 resistance and corrected lower against the US Dollar. ETH price is likely to remain stable above $1,450 and it could again climb towards $1,600. Ethereum corrected lower from $1,600 and tested the $1,450 support zone. The price is now trading just above $1,500 and the 100 hourly simple moving […]
Bitcoin price attempted another shot at the 4-hour chart 200-period moving average today without success. The market lacks conviction and price should draw lower as a result. Typical indicator behavior as per yesterday’s analysis: the price wave approached its top with MACD (top) touching its upper Bollinger Band and the stochastics (second from top) grouped at their upper maximum. Today’s bounce from the 20MA saw the momentum indicators diverge across the board – indicating trend exhaustion. Note how RSI (just above price) had diverged (magenta annotation) from the nominal new price high....

