Bitcoin Risks Deeper Losses If $107,800 Line Fails To Hold – Details
Since reaching a new all-time high of $124,427 on August 14, Bitcoin has entered a prolonged corrective phase, losing 12.18% of its value over the last two weeks. With market prices now moving within the $109,000 range, market analyst Yonsei_dent has identified a pivotal support level to the present bullish market structure. Related Reading: Analyst Forecasts Bitcoin Price Will Break This Support Level, Can $100,000 Hold? Bitcoin’s $107,800 Line In The Sand: Support Or Breakdown Ahead? In a QuickTake post on CryptoQuant, Yonsei_dent shares some technical insight into the Bitcoin market,....
Related News
A long-dormant Bitcoin “OG” has been rotating billions of dollars’ worth of BTC into ETH over the past two weeks, executing the bulk of the trades on Hyperliquid and withdrawing large tranches of ETH to self-custody—before staking a significant portion on the Beacon Chain. Bitcoin OG Whale Still Rotates Into ETH On-chain sleuth “MLM” has chronicled the flows in real time. In the most recent 46-hour window, the address cluster associated with the trader sold 7,000 BTC (≈$759 million at reference prices used by MLM) and bought 171,791.84 ETH (≈$773 million). MLM added that 3,000 BTC remained....
The European Banking Authority (EBA) has issued a warning on potential risks related to virtual currencies, but the warning is largely focused on the possibility of fraud and theft. The authority points out that consumers are not protected by union regulation when they buy, trade or hold virtual currencies such as bitcoin. In addition, the regulator warns that there is no guarantee that currency values will remain stable. The EBA was apparently prompted to issue the warning due to a sudden increase in virtual currency trading and the fact that virtual currencies are constantly in the....
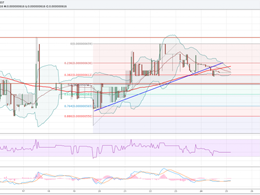
Dogecoin Price Key Highlights. Dogecoin price failed to hold gains, and moved below an important support area to call for more losses. The support trend line on the hourly chart as highlighted yesterday was breached to encourage sellers. The price has also moved below the 100 hourly simple moving average, which is a warning sign in the near term. Dogecoin price after failing to move above 66.0 Satoshis moved lower and broke an important support trend line. Trend line break. We followed a support trend line on the hourly chart, which was acting as a hurdle for sellers. However, they managed....
Bitcoin (BTC) stands firm at $93,257, a crucial support level that could determine its next major move. As the battle between bulls and bears intensifies, the stakes are high: a successful defense could spark renewed momentum, while a break below might trigger significant losses. As the market navigates this pivotal moment, this article aims to analyze BTC’s current position at the critical $93,257 support level, exploring the factors influencing its price movement. By examining key technical indicators and market dynamics, the goal is to assess whether the bulls can defend this level and....
Bitcoin is once again at a turning point as the market struggles to recover from heavy selling pressure. After losing the $115,000 level earlier this week, BTC is now fighting to hold $110,000, a threshold that many investors see as critical for maintaining short-term stability. The sharp drop has shaken confidence, with traders increasingly concerned about the possibility of a deeper correction if support fails. Related Reading: Aster Forms Bullish Hammer At Key Support – Reversal Setup? Market sentiment has shifted quickly from bullish optimism to caution, as volatility rises and....


