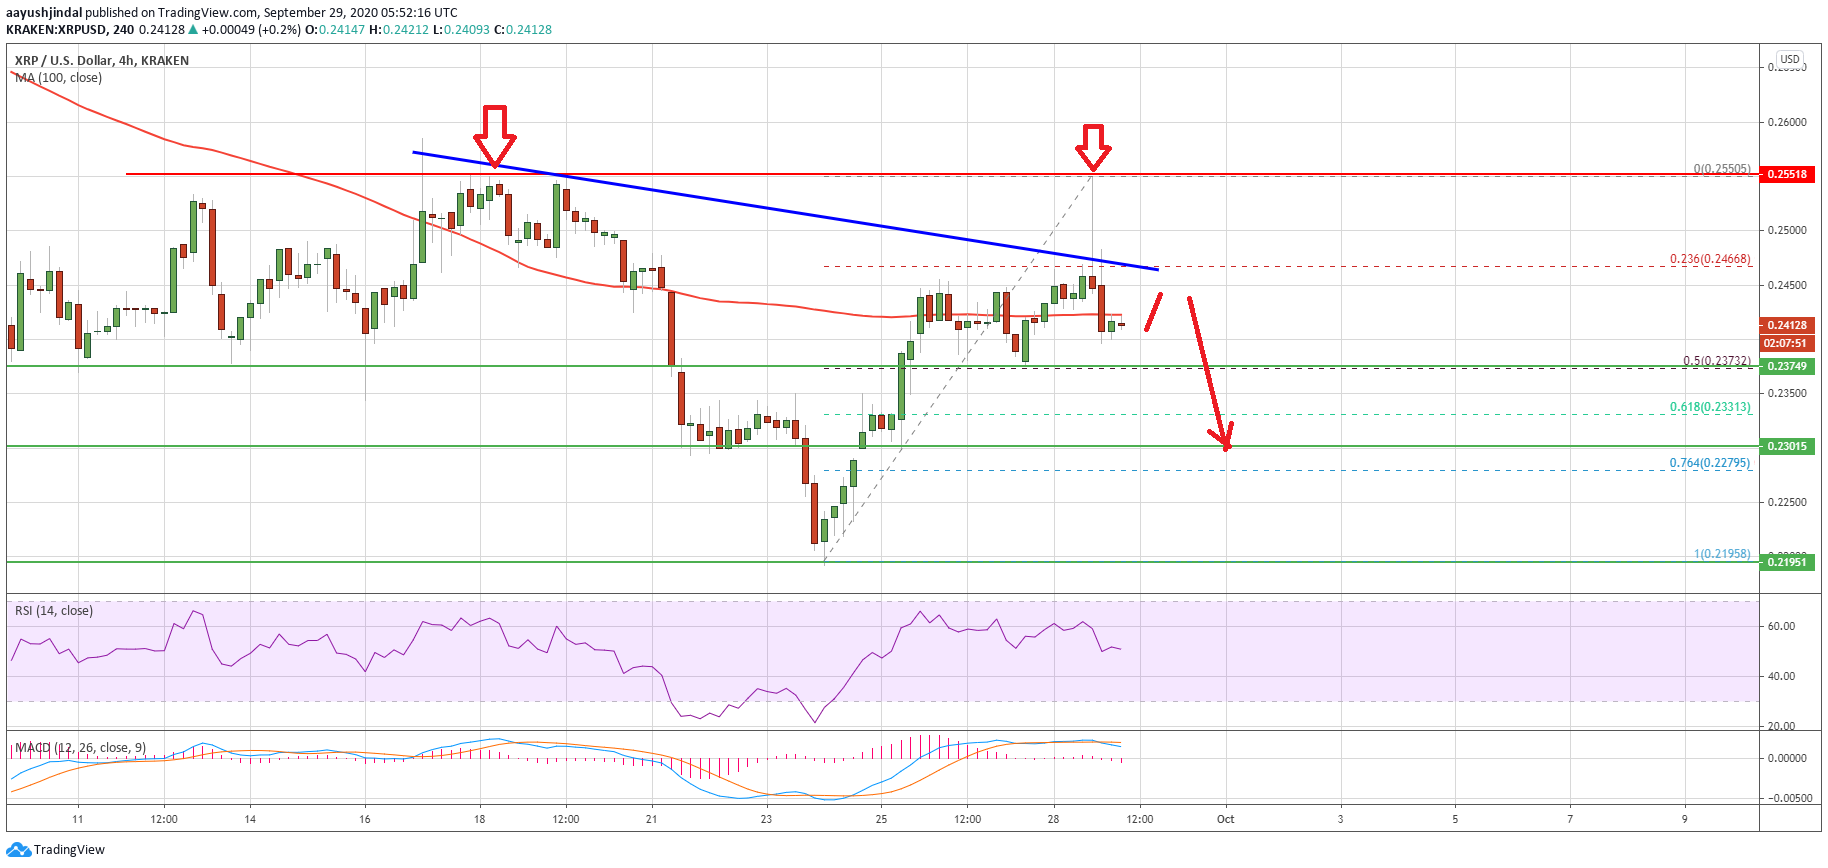
Ripple (XRP) At Risk of Sharp Decline, As Double Top Pattern Emerges
Ripple spiked higher and retested the key $0.2550 resistance area against the US Dollar. XRP price failed to break $0.2550 and it is now showing bearish signs below $0.2450. Ripple failed to clear the $0.2550 resistance level and likely formed a double top against the US dollar. The price is now trading well below the […]
Related News

Key Highlights. Dogecoin price made one more attempt to go pass 60.0 Satoshis, but failed as there was a lack of momentum. A crucial double top pattern might be forming, which can push Dogecoin prices lower in the short term. Buyers managed to take advantage recently and pushed prices of Doegoin higher, but it looks like there is a topping pattern in making that could ignite a short-term correction. Double Top Pattern. There was a sharp reaction noted around 50.0-50.6 Satoshis, which took the price back higher. An important level of 60.0 Satoshis was almost tested where Dogecoin failed....

Technical indicators are pointing to a major breakdown of the Dogecoin price, as an analyst projects a decline to $0.2. This bearish prediction could be game over for Dogecoin, as the meme coin has formed a Double Top pattern, indicating that it may experience further downside pressure this quarter. Double Top Pattern Signals Dogecoin Price […]

The selling pressure in the Bitcoin market is not as bad as it was during the Terra and Three Arrows Capital crises. Bitcoin’s (BTC) price may climb by more than 50% in September, a month otherwise considered ominous for the cryptocurrency due to its poor historical returns. BTC price double-bottom and then to $30K?The conflicting upside signal comes from a potential double-bottom pattern on Bitcoin’s longer-timeframe charts against the United States dollar. Double-bottoms are bullish reversal patterns that resemble the letter W due to two lows and a change in direction from downside to....
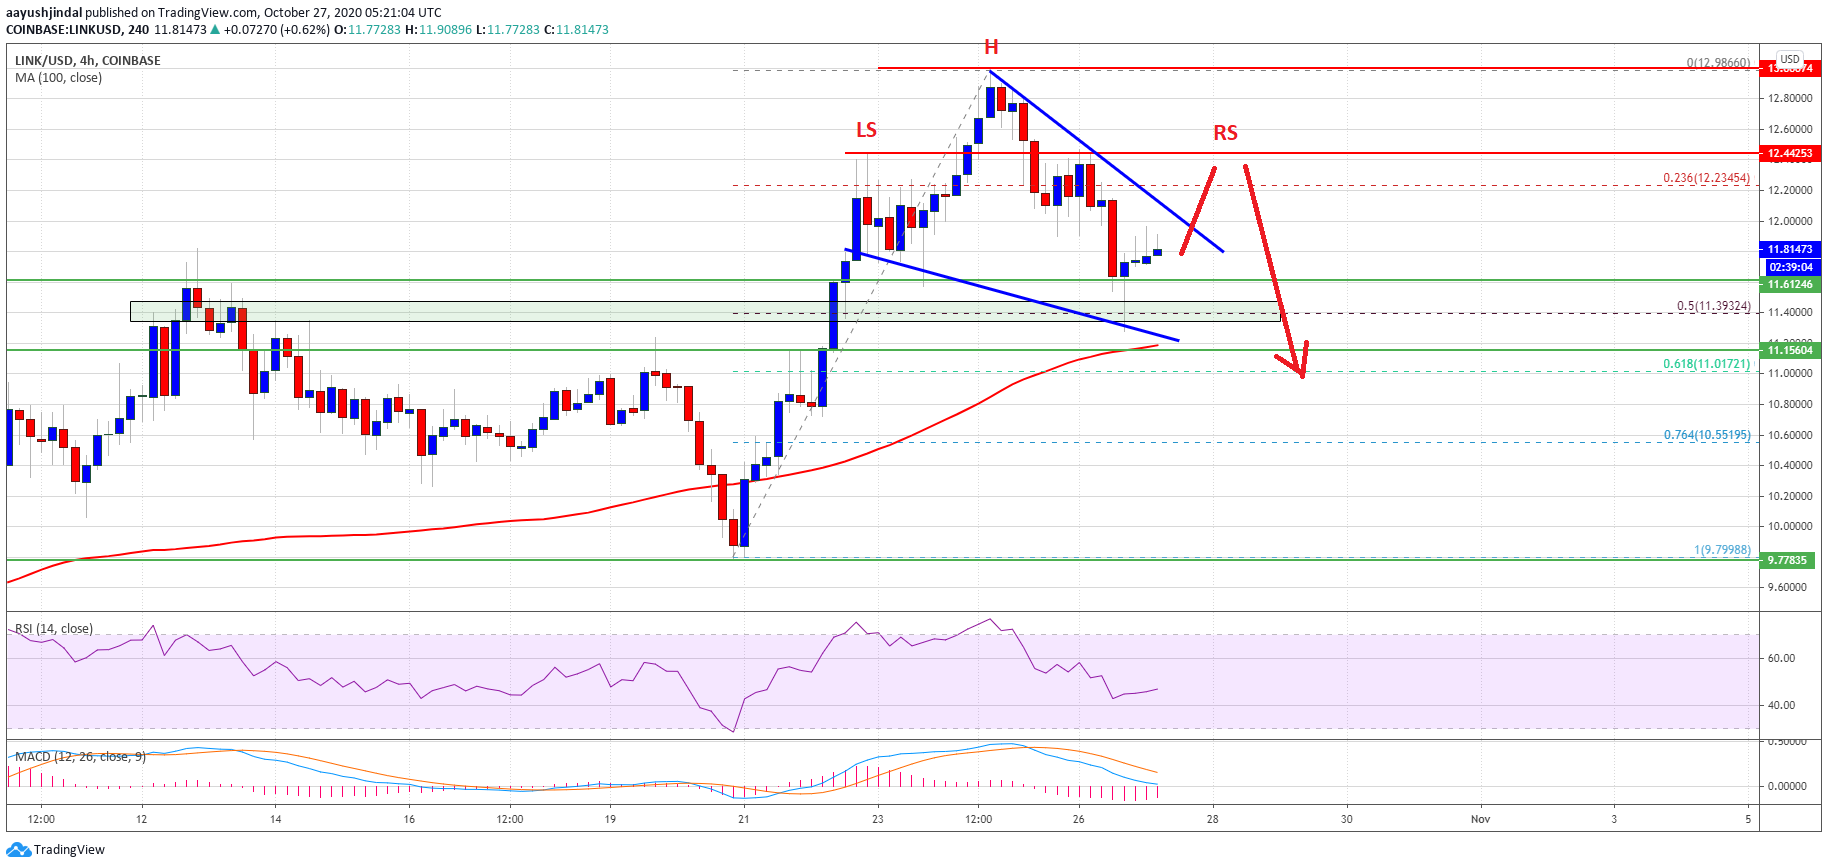
Chainlink (LINK) seems to be forming a short-term top near $12.98. A head and shoulders pattern is likely forming, which could trigger a sharp decline below the $11.50 support. Chainlink token price started a fresh decline after it failed to clear the $13.00 resistance against the US dollar. The price is holding the $11.50 support […]
Dogecoin Price Key Highlights. Dogecoin price continued trading in a range during the past couple of sessions, and remains at a risk of a break. There is a breakout pattern forming on the hourly chart with an important resistance around 56.0-57.0 Satoshis. Our highlighted double top pattern is still valid, but it is fading slowly as sellers failed to gain momentum. Dogecoin price continued to consolidate in a range, and currently forming a contracting triangle pattern for a break. Triangle Pattern. We have been following a double top pattern on the hourly chart, and waiting for a break.....