
TA: Bitcoin Starts Corrective Decrease, $53K Holds The Key
Bitcoin started a downside correction from the $55,700 zone against the US Dollar. BTC is correcting lower, but dips remain supported near $53,000 and $53,200. Bitcoin started a downside correction from well above the $55,500 level. The price is now trading above $53,000 and the 100 hourly simple moving average. There was a break below a key bullish trend line with support near $53,100 on the hourly chart of the BTC/USD pair (data feed from Kraken). The pair could correct lower, but the bulls are likely to remain active near $53,000. Bitcoin Price Corrects Lower Bitcoin price remained in a....
Related News
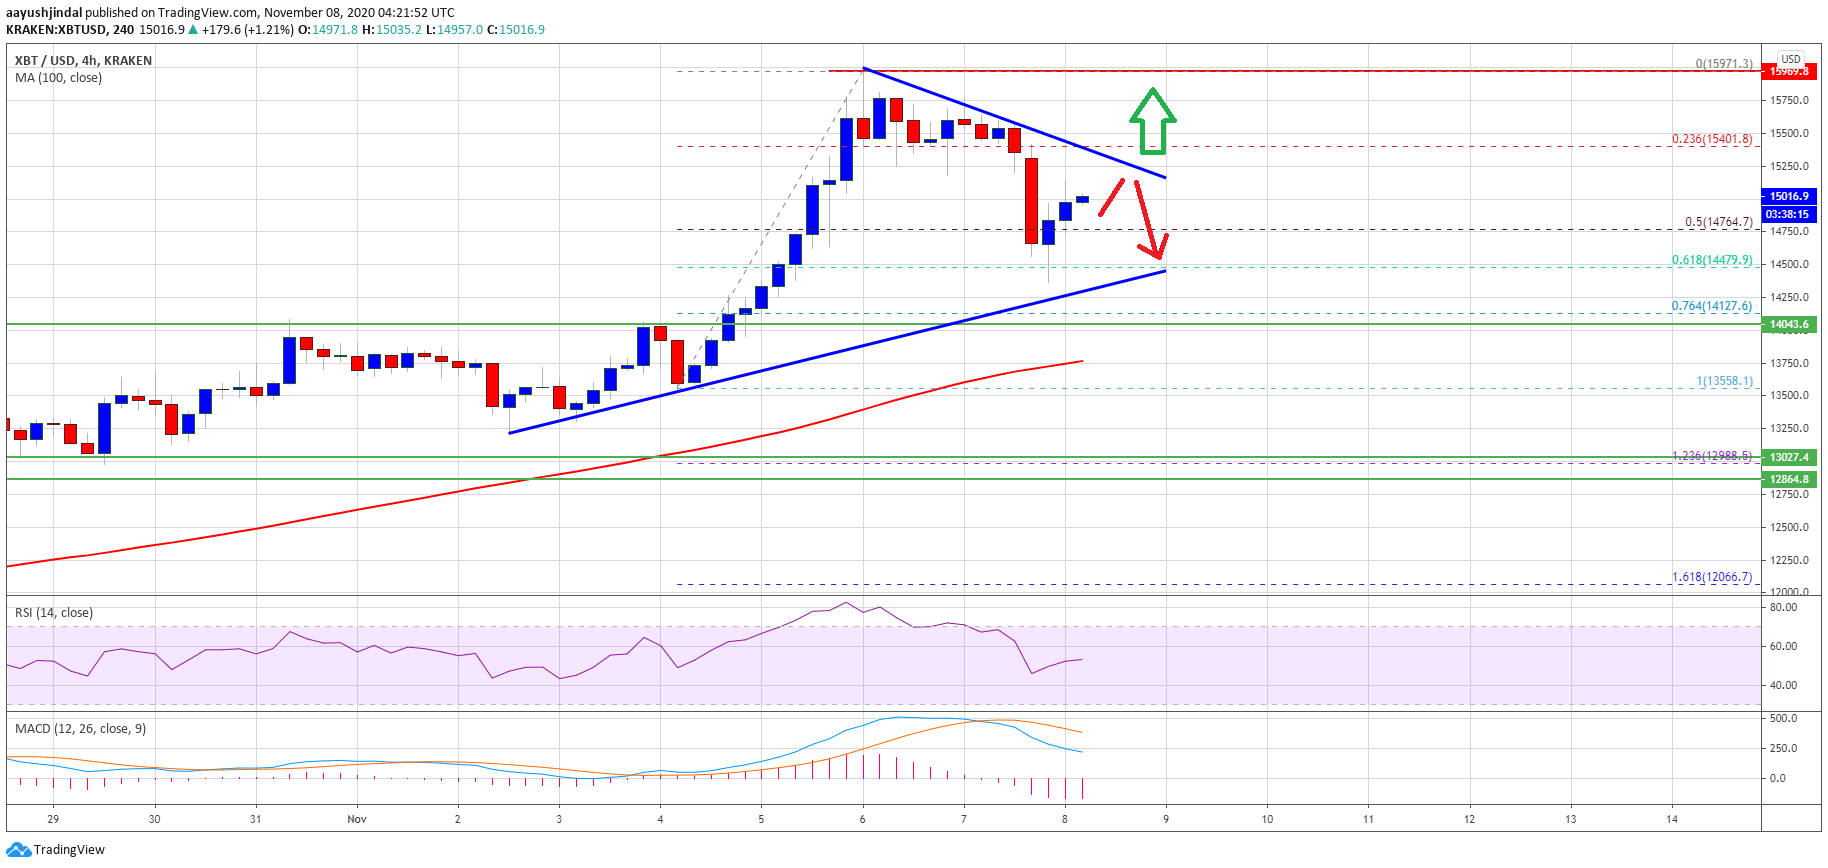
Bitcoin price traded to a new multi-month high near $15,970 before correcting lower against the US Dollar. BTC is holding the $14,500 support and it could start another rally. Bitcoin started a sharp downside correction after trading close to the $16,000 resistance. The price corrected lower below $15,000, but it is still well above the […]
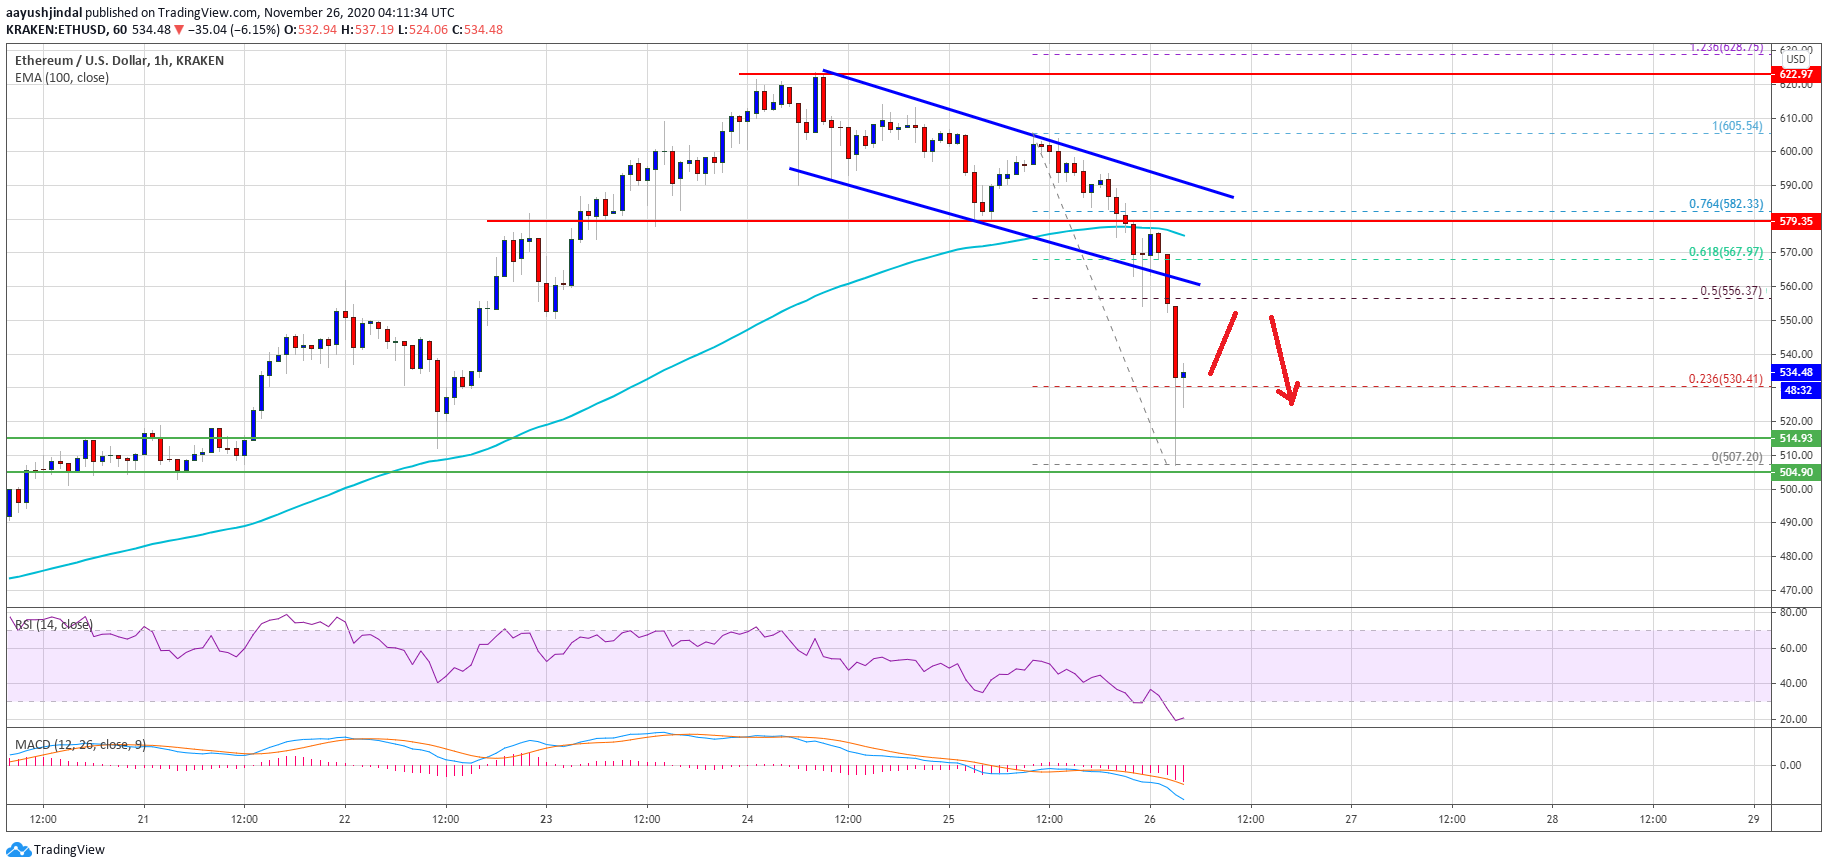
Ethereum formed a short-term top near $620 and started a sharp decline against the US Dollar. ETH price is correcting gains and it could revisit the $500 support zone. Ethereum started a downside correction after it failed to stay above the $580 support. The price traded below the $550 support and the 100 hourly simple […]
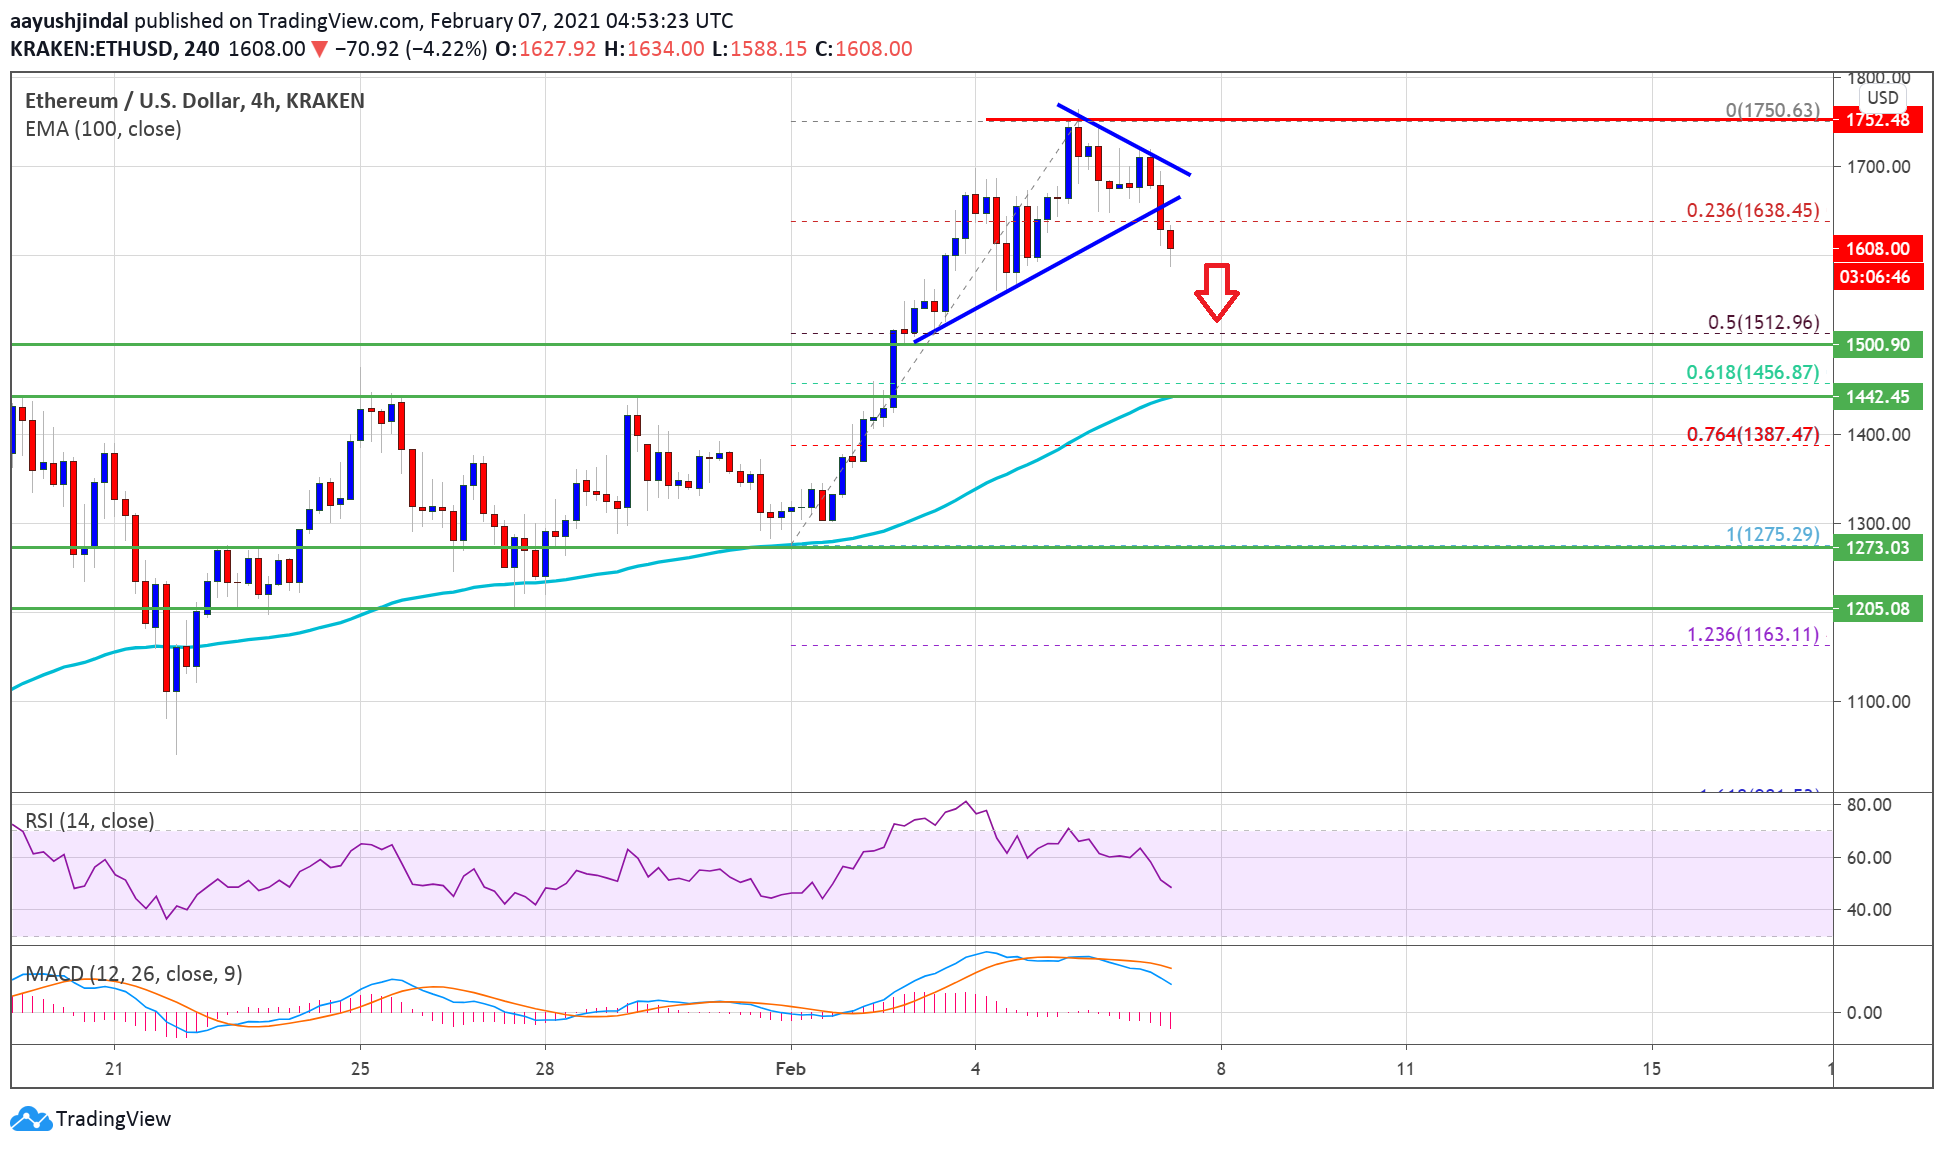
Ethereum traded to a new all-time high near $1,750 before correcting lower against the US Dollar. ETH price is likely to find a strong support near $1,500. ETH price traded to a new all-time high at $1,750 before it corrected lower against the US Dollar. The price is trading below $1,650, but it is well […]
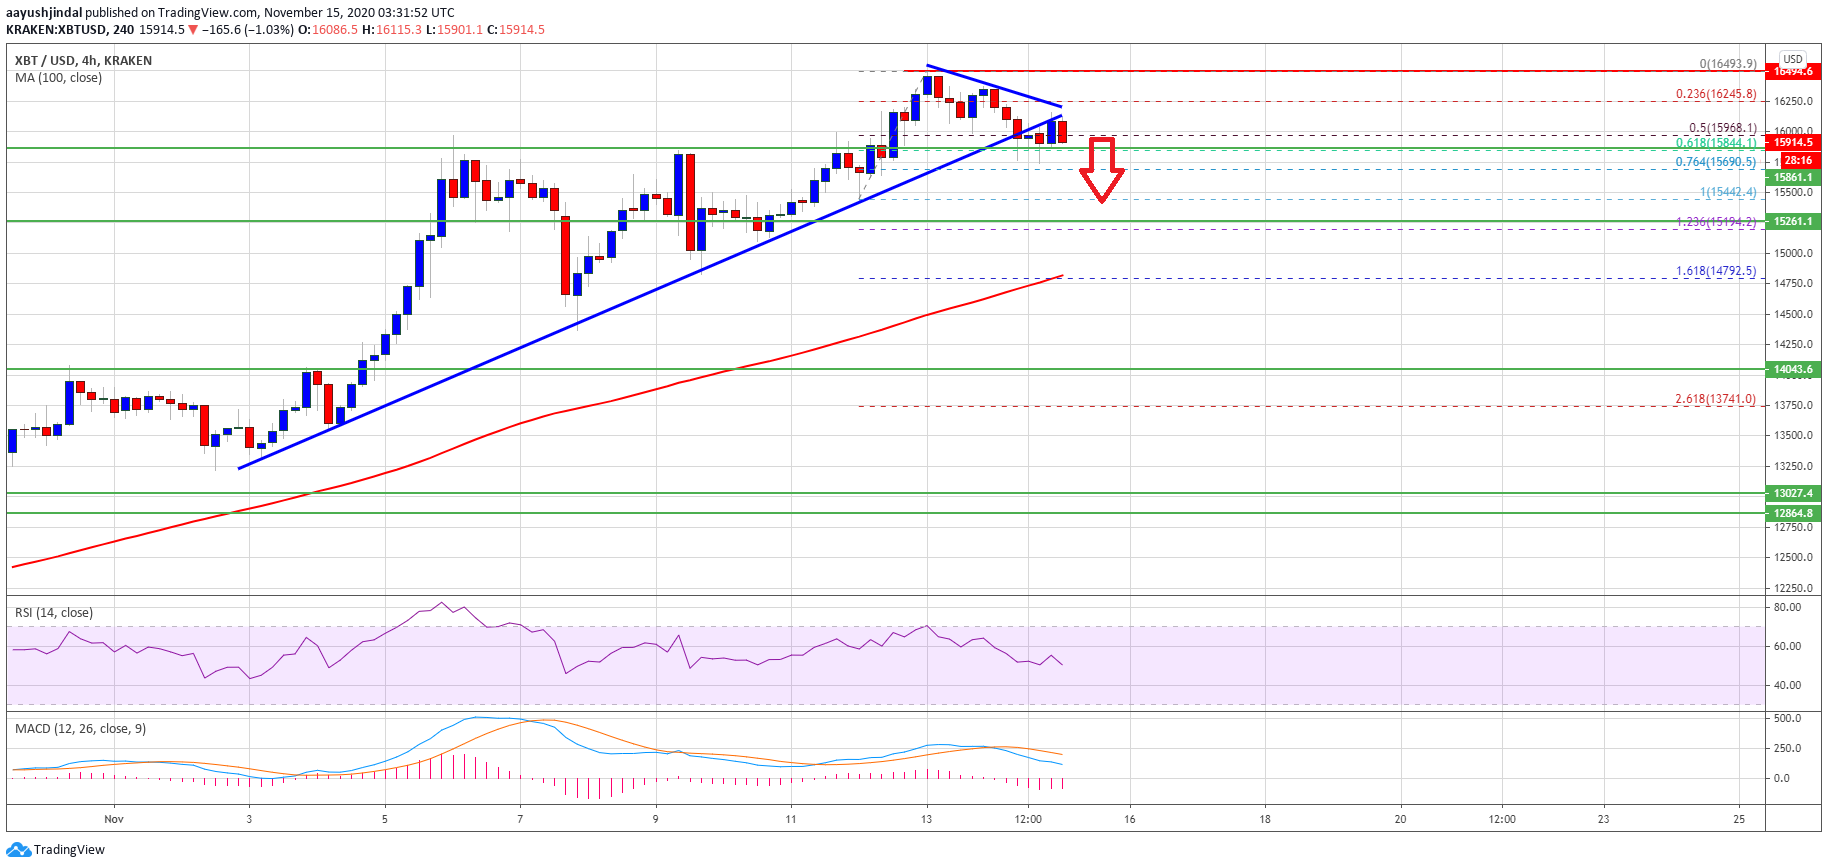
Bitcoin price traded to a new multi-month high close to $16,500 against the US Dollar. BTC is now signaling a downside correction and it could test the $15,200 support. Bitcoin traded above the $16,000 resistance and almost tested the $16,500 zone. The price is now correcting below $16,000, but it is well above the 100 […]

Bitcoin price was pushed higher by eager buying today. The price move shows signs of being a corrective advance that will soon give way to the declining scenario discussed in weekend analysis. Although the resistance ceiling is still some distance above price, it is likely that the current advancing wave is close to making (or has already made) a corrective top. The wave looks aggressively impulsive, but there is no reason to believe it will achieve a new high above the top formed nine days ago. There are no buy signals at any timeframes and the indicators are generally overbought. In many....