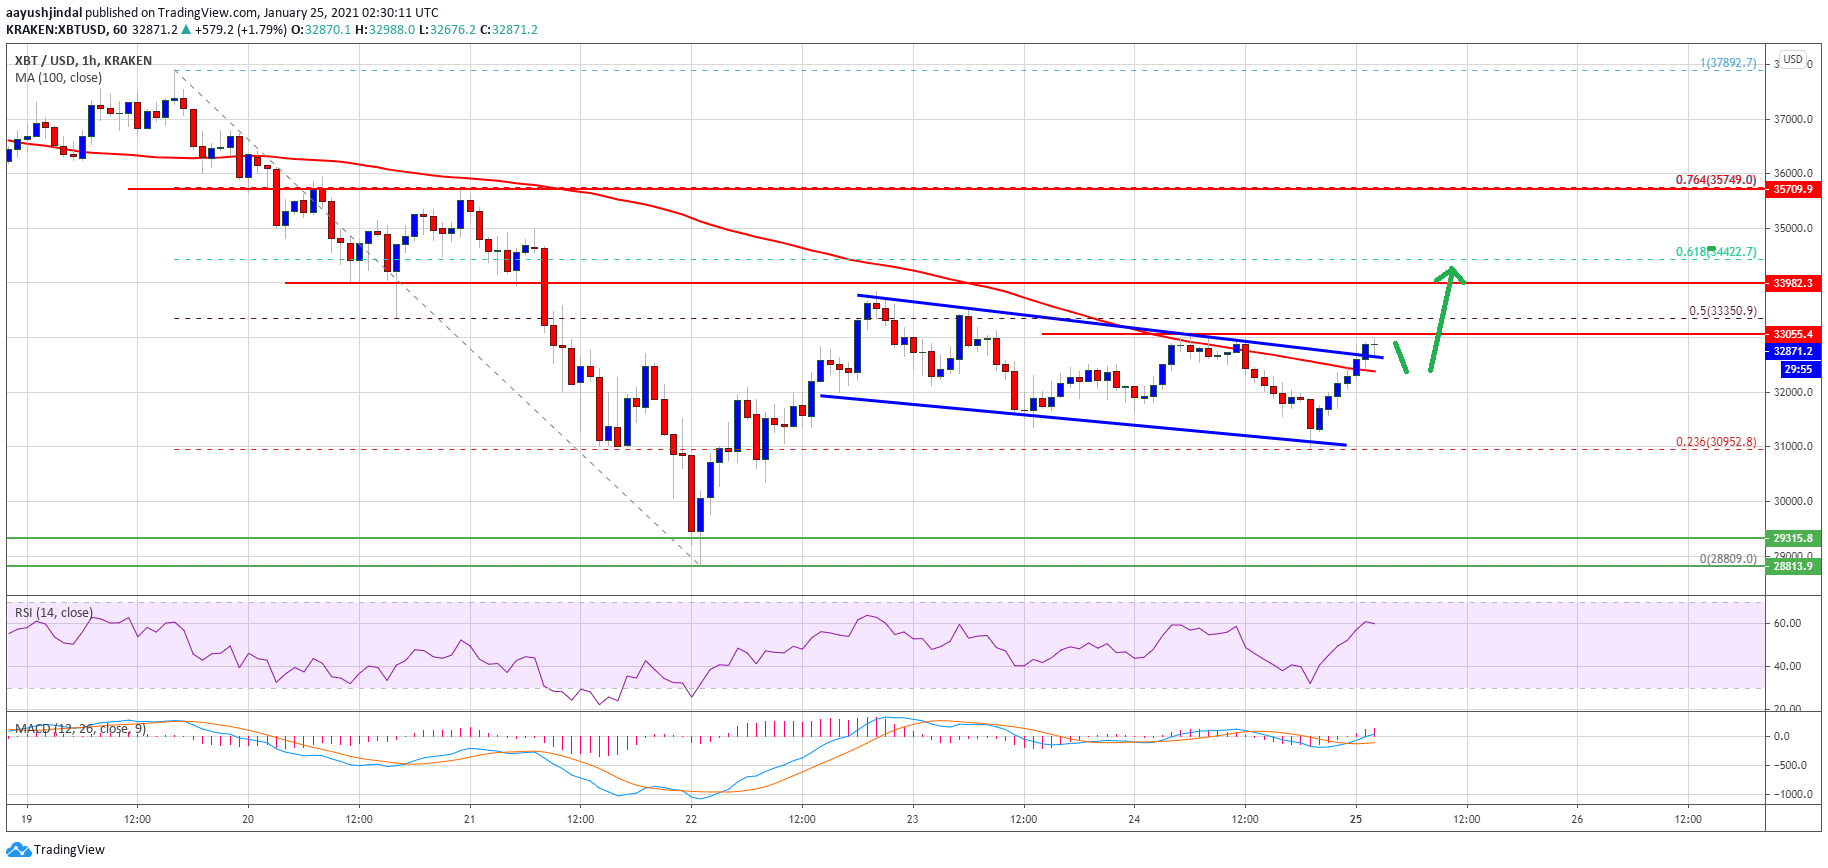
TA: Bitcoin Consolidates Below $33K, Why BTC Could Attempt Bullish Break
Bitcoin price is slowly recovering above $32,000 against the US Dollar. BTC is likely to face a strong selling interest near $33,500 and $34,000. Bitcoin seems to be consolidating above the $31,000 and $32,000 support levels. The price is currently just above $32,500 and the 100 hourly simple moving average. There was a break above […]
Related News

Ethereum tested the $3,380 zone before it corrected lower against the US Dollar. ETH price is still trading above $3,300 and it might attempt another upside break. Ethereum started a fresh increase above the $3,300 and $3,320 resistance levels. The price is now trading above $3,250 and the 100 hourly simple moving average. There is a key bullish flag forming with resistance near $3,340 on the hourly chart of ETH/USD (data feed via Kraken). The pair could continue higher if there is a clear break above $3,340 and $3,350. Ethereum Price Consolidates Gains Ethereum settled above the $3,300....
Bitcoin price is struggling to clear the $62,500 resistance against the US Dollar. BTC could decline heavily if there is a close below $60,000 in the near term. Bitcoin is facing resistance near the $62,500 and $62,650 levels. The price is now trading below $61,500 and the 100 hourly simple moving average. There is a major bullish trend line with support near $60,500 on the hourly chart of the BTC/USD pair (data feed from Kraken). The pair could accelerate lower if there is a clear break below $60,000. Bitcoin Price Stuck In Range Bitcoin price made another attempt to clear the $62,500 and....
Bitcoin price is struggling to hold the ground and if buyers fail to prevent a break on the daily chart, then more losses are likely. Bitcoin price was under a lot of bearish pressure throughout this past week, as it traded down. There was an attempt to trade and break the $400 handle, but sellers defended it successfully. The price traded as high as $391 where it stalled and started moving down. Looking at the higher time frame chart, there is a critical bullish trend line formed on the daily chart (data feed from HitBTC). I highlighted the same trend line this past week as well, and was....
Bitcoin price is slowly crawling higher with the rising channel still intact, but a downside break and reversal might be looming. The 100 SMA is below the 200 SMA for now so the path of least resistance might be to the downside. However, an upward crossover appears to be taking place to show a pickup in bullish strength. If so, bitcoin price could make a stronger attempt to rally towards the channel resistance. Stochastic is making its way down from the overbought level to show a return in bearish pressure. RSI is also heading south so bitcoin price might follow suit. In that case, price....
Ethereum price started a fresh decline and traded below $2,080. ETH is now consolidating above $2,050 and might struggle to recover. Ethereum remained in a bearish zone after a fresh decline. The price is trading below $2,100 and the 100-hourly Simple Moving Average. There was a break below a bullish trend line with support at $2,095 on the hourly chart of ETH/USD (data feed via Kraken). The pair could continue to move down if it stays below the $2,100 zone. Ethereum Price Consolidates Losses Ethereum price failed to remain stable above $2,120 and started a downside correction, like....