
Bitcoin Bulls And Bears Tussle Price, Where Will Price End Up?
BTC price ranges below 50 and 200 EMA on the daily timeframe. Price continues to range in an asymmetric triangle during the four-hourly timeframe. BTC price closes the week bearish for two weeks as the price gets stuck between bulls and bears. The price of Bitcoin (BTC) has seen more of a drawback than a rosy state this month as prices continue to decline against tether (USDT). September wasn’t a good month for the price of Bitcoin (BTC) as the market continued to stall in its movement to the upside. The statistics from the coupled Consumer Price Index (CPI) and Federal Open....
Related News

Cardano (ADA) prices show that the bulls are trying to overpower the market to diminish the bearish trend. ADA prices have been lingering steadily at $0.5, and a rejection strung at $0.628. More so, there has been a marked price decline of 7% in the market seen the previous days as the bearish trend takes over. The current market trading level is now at $0.524, which is pivotal as there seems to be a power struggle between the bulls and the bears. Suggested Reading | Avalanche Crumbles More Than 16% As Crypto Landslide Continues Support At $0.50; Bulls Try To Up Market Prices Support....

Bitcoin’s bull flag will determine whether bears push the price to $14K or if bulls finally take the $16K mark. Bitcoin price (BTC) appears to be taking a short breather after reaching a new 2020 high at $15,960 on Nov. 5. The 1-hour and 4-hour timeframe show the price compressing within a flag and throughout the majority of the trading day, the $15,500 level has held as support. $15,750 is the level Bitcoin needs to break in order to pursue another stab at $16,000. BTC/USDT 4-hr chart. Source: TradingViewWithin the last hour, a dragonfly doji candle formed as the price swept low to test....
ETH’s price struggles to break above key resistance as the price continues to trade in a range mimicking the price of Bitcoin. ETH continues to struggle as price trades close to the demand zone. The price of ETH continues to look indecisive as price trades below 50 and 200 Exponential Moving Average (EMA) on the daily timeframe. The price of Ethereum (ETH) in recent times has looked like it has lost its steam to rally against tether (USDT) as the price has remained in a range-bound movement for over weeks. Despite the uncertainty that has befallen the crypto market in recent....

While Bitcoin price is fighting to hold above the 200-day SMA, ALGO, ATOM, XTZ, and EGLD continue to march higher. Bitcoin (BTC) is witnessing a tough tussle between the bulls and the bears near the 200-day simple moving average, which is considered as an important level by institutional investors attempting to decide whether the asset is bullish or bearish.Along with this, crypto investors are also watching the formation of a golden cross in Bitcoin. If this bullish setup completes, it will signal a trend in favor of the bulls. For the time being, investors continue to focus on select....
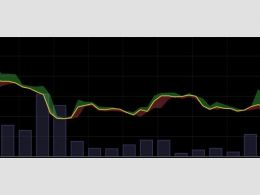
As all recent charts indicate, the bitcoin price isn't doing that well as bears seem to dominate the market. The sudden buy pressure that we've started seeing after the bitcoin price started falling below the support level of $220 might result in another correction. It's Bears vs Bulls once again. It's still hard to make out if the bulls managed to overcome the bears after the support level of $220 was breached. However, it's clear that most positive btc price spikes today were met with a negative overturn despite the healthy buy activity. As seen on the chart below, the price only managed....