Longterm Technical Analysis of the Bitcoin Price
This analysis report take an historical perspective of the BTC/USD price chart. In the absence of the most complete historical price chart, namely that of Mt. Gox, this report will use the BTC-e chart, and try to make sense of all its spikes and idiosyncracies, in an effort to make both medium / long term forecasts and price predictions for the BTC/USD pair. Takeaway. Technical analysis reveals that BTC/USD has a medium term upside target above $2,000 (see chart below). However, there is no conclusive sign that the decline since December 2013 is over. A break above the upper resistance TL....
Related News
Bitcoin price is advancing after crossing above another longterm trendline drawn from the November 2013 all-time high. A bumpy ascent looks set to continue as price struggles through layers of divergence and resistance toward $300 / 1870 CNY. This analysis is provided by xbt.social with a 3 hour delay. Read the full analysis here. Not a member? Join now and receive a $29 discount using the code CCN29. Bitcoin Value and Price Analysis. Time of analysis: 13h00 UTC. BTC-China 15-Minute Chart. From the analysis pages of xbt.social, 13h00 today: Not much has changed since the last update. Three....
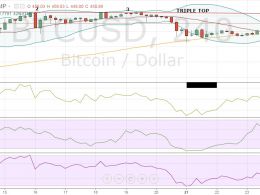
The Christmas isn’t turning out to be merry for Bitcoin. The cryptocurrency is struggling near the overhead resistance of $465. It is now trading 1.28% lower at $450.89, raising concerns that the market participants might pull out their funds in the holiday season. As a result, several technical indicators are also showing declines. We advised in the previous Bitcoin price technical analysis Target Achieved that traders should book at least partial profits in their long positions. And for today’s analysis, we will again be using the 4-h BTC-USD price chart from BITSTAMP.
Technical Analysis is a method for analyzing price through the study of historical data primarily focusing on price and volume specific to the market. Contrary to fundamental analysis, technical analysis is purely quantitative and does not account for a company’s intrinsic value. It utilizes previous prices and trading action to identify patterns within....
Bitcoin rises more than 2 percent to $430.21, nearing our year-end target of $440. In the previous price technical analysis A No Trade Market, we mentioned that an increasing MFI often causes price appreciation, and we are witnessing just that. The question now is: Would bitcoin be able to extend the gains or will it retrace its steps? Let us try to predict this with the help of technical analysis conducted on the 240-minute BTC-USD price chart. Bitcoin is well poised to increase its duration inside the $400-440 range, at least for the next couple of sessions. There is a high probability....
Bitcoin price is pushing toward its three-month resistance ceiling. Technical and sentiment analysis argue for a return to decline, and fundamental analysis shows that Bitcoin’s value is more fragile than many realize. Friday’s technical analysis concluded that the outlook for bitcoin price is bearish while price fails to break above the prevailing resistance ceiling (blue down-sloping line in the chart). Going forward, technical analysis will be informed by the position of price in relation to this ceiling: if the market can successfully trade price above it, we can expect continuing....


