
Daily Bitcoin Market Price Update: Bull Market In Sight
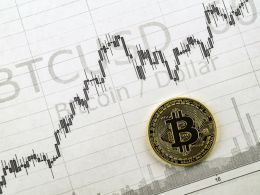
Yesterday we analyzed the bitcoin market from a weekly perspective and saw that we are, in all likelihood, very close to the beginning of a bull market. However, the weekly chart is unclear about whether or not there may be another week of selling. My analysis and the charts you see herein are based upon bitcoin price as reflected on Bitstamp. Daily Chart - Bearish Setup. Today we will look at the daily chart of the bitcoin market to get a closer look at what the charts are telling us. Here I have elected to use an eight candle bearish setup from the June 2014 high. Note first of all that....
Related News

According to data from CoinMarketCap, Bitcoin (BTC) appears to have finally found some stability in September, recording a price gain of nearly 13% in the last week. Interestingly, crypto analyst Burak Kesmeci has unveiled a certain condition behind this price rise which could prove vital in initiating a market bull run. Related Reading: Bitcoin Backed […]

Digital asset markets have recaptured some of the losses taken three days ago, as a great majority of the crypto economy has started to rebound after the market rout. Bitcoin has climbed above the $18k handle once again and a myriad of crypto assets are up between 1-6% during the last 24 hours. After dropping to a low of $16,300 per coin, bitcoin (BTC) has rebounded 11.3% to where the price stands today at $18,138 per unit. BTC is still up 33% for the last 30 days, 54% for the last 90 days, and 139% against USD for the last 12 months. Bitcoin’s dominance index, in comparison with the....
Following up on the weekend look at Bitcoin’s long term price chart, we will look again today at the long term (8 day candle) chart of BTC, per Kraken. Over the weekend we looked at a Bull Setup. As we saw, that setup suggests a bull move that will likely last several more months. But of course, it goes without saying that there are both bulls and bears in the market at pretty much any given moment. I expect that is well understood by everyone reading this article. So, it is not enough to just look at a bull setup as we did in my last article. We want to gauge bear strength also. So let’s....

In the middle of an outstanding bull market for the whole crypto space, Ethereum stands out in a big way. And it’s easy to see why. On one hand, we have the rise of DeFi and the NFT craze. On the technical side, we have the EIP-1559 update coming in July. And on the corporate […]

Bitcoin price is at an inflection point, with nearly every technical indicator mixed due to the weeks of sideways price action. By most standards, technicals slightly lean bearish, but crypto investors are hopeful the secular bull market remains intact. Thus far, the bull market has held on by a string, or a thin line of […]