Bitcoin Price Stalled
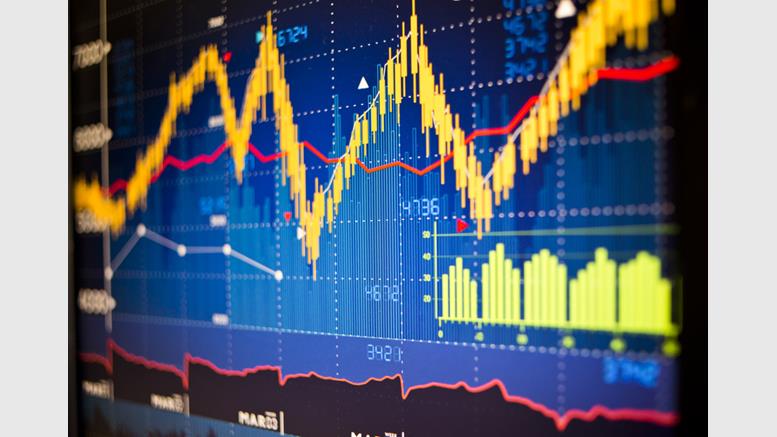
In the past few days, we advised traders to consider taking profits ~$344. It turns out that the magic number was a few dollars shy of that figure ($338). We also suggested that when the next pullback occurred we could possibly get a test of the long term support line. As I am writing these words, price has touched that support line. For now at least, that support is holding. See the 3-day chart below. As long as we do not get a close below that support line I will remain medium-term bullish. I continue to expect that the market will rise as soon as the price passes through the 2nd arc....
Related News
Key Highlights. Litecoin price after attempting a correction failed, and currently heading lower. The price breached a monster support area, which is signaling towards more declines ahead. Litecoin price clearing a critical support area is a warning sign to buyers and could ignite a downside move. Litecoin price solid run towards the upside failed around $8.98, as it traded lower. The downside was stalled around $3.24. It was a monster decline, as pointed in the previous weekly analysis. However, buyers made an attempt to take the price higher, but the upside was stalled just below the....

During the April 22nd session, bitcoin uncoiled upwards. The 1H chart shows not only a breakout from volatility, but also above consolidation resistance near 230. As the session wound down, the rally stalled around 239 at which point price stalled and formed a bearish divergence with the RSI. (When price makes a higher high and the RSI a lower high). Bitcoin (BTCUSD) 1H Chart April 23. After finding resistance at 239 along with the bearish divergence, price retreated as the April 23rd global session began. The pullback has been weak so far, holding around 233. The technical conditions in....
Bitcoin seems to have stalled below the resistance we have been talking about. After a strong bullish action a day before, Bitcoin spent the day in a thin range of $292-297 and is now trading at $294.10, down $1.66 or 0.56 percent. The technical indications remain highly positive. What worries me is that, if the ongoing struggle continues for too long, then the probability of bulls winning another round reduces drastically. Take a look at the technical picture of the daily BTC-USD price chart below. Bitcoin Chart Structure - It has been 5 straight sessions that Bitcoin has traded close to....

The Bitcoin performance over the last year has disappointed investors as the cryptocurrency’s price has stalled below $100,000. Even now, with the price seeing some recovery, it has remained muted, and there has not been any notable recovery in the price. With the second quarter coming to an end, a crypto analyst has outlined what […]
XRP’s efforts to regain upward momentum following last week’s sharp decline have so far stalled, with $1.50 now rising as the most important price level. A new technical analysis shared by crypto analyst Tara points to Bitcoin’s unfinished price structure as the main reason why XRP’s price action is still stuck below $1.5, with the […]