Dogecoin Price Technical Analysis (21st - 27th January)
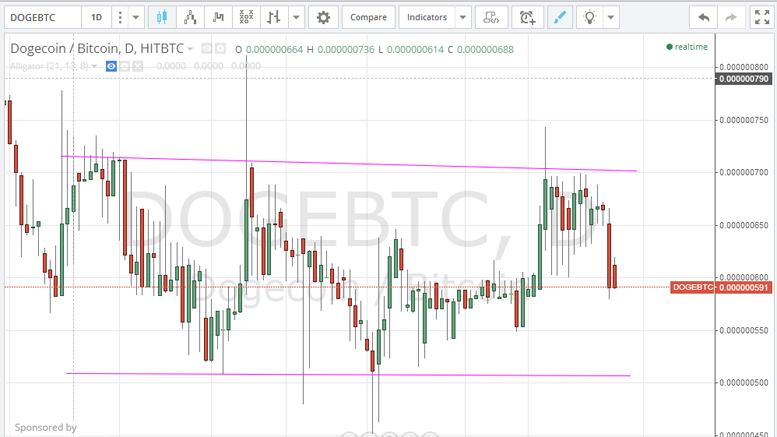
The price of Dogecoin declined over the past week (21st-27th of January) from 70 to 61 satoshis at the time of writing of this article. By studying the 1 day Hitbtc DOGE/BTC charts from tradingview.com (look at the below chart), we can clearly see a bullish rally that pushed the price of Doge up to around 74 satoshis on the 14th and 15th of January; this coincided with the fall in the price of bitcoin which dropped to $162 on the 14th of January. Since last November, the price of Dogecoin seems to have been oscillating between 70 and 51 satoshis (look at the 2 pink trend lines on the below....
Related News

Technical analysis shows that Dogecoin is looking to break out from a key structure zone near $0.26, which could cause a change in market momentum. This technical outlook comes amidst a bearish week for DOGE, which has seen it breaking below support levels and erasing its gains throughout January. According to a technical analysis of […]

Dogecoin is holding firm above major support at $0.22 despite repeated threats to break below in the just concluded week. Amidst these fluctuations, an interesting technical indicator suggests that Dogecoin’s long-term rally is still intact. This technical indicator’s outlook was pointed out by crypto analyst Trader Tardigrade, who used the Gaussian Channel, a popular momentum tool, as evidence that Dogecoin’s bullish momentum is still in play despite the current selling pressures. Related Reading: Dogecoin Whales Go On A 110-Million Memecoin Buying Spree—What’s Next For DOGE?....

Dogecoin has undergone a massive correction of roughly 10% in the past 24 hours, with the price nose-diving from 49.8 satoshis to 45.1 satoshis. As a result of this fall, Dogecoin has neared the floor of 43 satoshis, which if cracked, could lead to a severe collapse in the price. But, will it? Let us find out with the help of technical analysis below. Technical analysis implemented on the 240-minute Dogecoin/Bitcoin price chart reveals that bears are pouncing on every opportunity to jettison Dogecoin en masse. The support of 43 satoshis may well give way to a lower ground, if bulls....
Dogecoin has yet to reclaim the $0.3 price level due to bearish price action in the past few weeks, but technical analysis shows that it is destined for a run above double digits. Particularly, a technical outlook shared on the TradingView platform indicates that the Dogecoin price chart is currently playing out a macro breakout […]

An absolute calm has engulfed Dogecoin as the price remains trapped in a tight range of 50.8-51.9 satoshis. The market is severely testing the patience of the short-term traders, who now fear that a surprise breakout could trigger huge losses. The market may be waiting for a trigger to break free but until that happens, it would only be wise to trade the range with minimum quantities. Dogecoin price chart, Dogecoin analysis. Nothing much has changed in the past 24 hours in terms of price (the current value of each Dogecoin is 51.1 satoshis) but the chart structure has definitely....